Measure the Frequency Response of an Audio Device
The frequency response is an important tool for characterizing the fidelity of an audio device or component.
This example requires an audio device capable of playing and recording audio, and a loopback cable.
To learn more about how the example records and plays audio data, see audiostreamer. To see how you can make a similar measurement with an app instead of code, see Impulse Response Measurer.
Description of Frequency Response Measurement Techniques
A frequency response measurement compares the output levels of an audio device to known input levels. A very basic measurement consists of a few test tones, for example: low, mid, and high. A flat response indicates an audio device that responds equally to all frequencies. In this example you perform a frequency response measurement using a sine sweep, which is a tone that starts at a low frequency and increases progressively to a high frequency. This method computes the impulse response of the audio device and transforms it to the frequency domain. This method also allows you to measure round-trip latency, which is the time audio takes to go through the audio drivers and the device.
Setup Experiment
To measure the response of the audio device, a loopback cable is used to physically connect the audio-out port of the sound card to its audio-in port.

Audio Device Streamer
To start, use the audiostreamer object to setup the connection to the audio device. This example uses a MOTU audio device with a 96 kHz sampling rate and selects the "ASIO" driver (Windows only). Also, select channel 3 for the player and channel 3 for the recorder.
sampleRate = 96e3;

as = audiostreamer( ...
    Mode="full-duplex", ...
    SampleRate=sampleRate, ...
    Driver="ASIO", ...
    PlayerChannels=3, ...
    RecorderChannels=3);
By default, the audiostreamer object is created with the default device corresponding to the selected Driver (ex.: "ASIO"). However, you can select another Player and Recorder device using tab-complete suggestions, getAudioDevices, or with getPlayerNames and getRecorderNames.
Build a table of ASIO devices and select the MOTU device instead of the default (second in the list).
devices = struct2table(audiostreamer.getAudioDevices);
asioDevs = devices(devices.Driver=="ASIO",:)asioDevs=2×5 table
"ASIO MADIface USB" "ASIO" 54 54 44100
"MOTU M Series" "ASIO" 8 4 44100
as.Player   = asioDevs.Name(2); % use tab-complete or the name from the table
as.Recorder = asioDevs.Name(2);
as % display settings
as =
  audiostreamer handle with properties:

          Mode: 'full-duplex'
        Driver: 'ASIO'
      Recorder: 'MOTU M Series'
        Player: 'MOTU M Series'
    SampleRate: 96000

  Show all properties
With ASIO, you can also check the device settings. For example, it is best to set the sample rate to 96 kHz to avoid any transient behavior (if it was set to another rate before).
asiosettings(as) % same as asiosettings("MOTU M Series")Test Signal
Create a sweep with a level of -12 dB and a frequency range of 1 Hz to the Nyquist frequency (sampleRate/2).
The duration of the sweep is 9 seconds, followed by a period of 1 second of silence, for a total measurement duration of 10 seconds. The period of silence should be long enough for any impulse to go to zero. In this case, one second is plenty because there is just a cable and a fraction of a second of latency. However, if you are measuring a loudspeaker in a room, you need to increase this period of silence to several seconds to account for the acoustic echo that will be included in the measurement.
sineSweep = sweeptone(9,1,sampleRate, ...
    SweepFrequencyRange=[1 sampleRate/2], ...
    ExcitationLevel=-12);

t = (0:length(sineSweep)-1)/sampleRate;
plot(t,sineSweep)
title("Sine Sweep")
xlabel("Time (s)")
ylabel("Amplitude")
grid on

Frequency Response Measurement
Use playrec to both play and record. This function can also return the recording.
yrec = playrec(as,sineSweep);
Make sure there was no audio that was dropped during the measurement.
underruns = getUnderrunCount(as)
underruns =
0
Release the device. Otherwise, it is still "in use" by MATLAB.
release(as)
Impulse Response Measurement Results
Use impzest to compute the impulse response. This function takes as input the sweep tone played and the response that was recorded and computes the impulse response in between.
ir = impzest(sineSweep,yrec);
Plot the impulse response.
t = (0:size(ir,1)-1)/sampleRate;
plot(t,ir)
xlabel("Time (s)");
ylabel("Amplitude");
xlim([0 size(ir,1)/sampleRate])
title("Audio Device Impulse Response")
datatip(gca().Children(1),0.04716,0.4164);
grid on

The impulse response clearly shows the device latency, which is the delay before the impulse starts. You can also use xcorr to compute it. Use a maximum delay of 1 second (sampleRate samples). Show the delay in samples and in milliseconds.
xc = xcorr(yrec,sineSweep,sampleRate);
% Find the peak correlation
[~,idx] = max(xc);
% Subtract xcorr maxlag from 0-based index
delaySamples = (idx-1) - sampleRate
delaySamples =
4527
delayMS = 1000*delaySamples/sampleRate
delayMS =
47.1562
Alternatively, you can use measureLoopbackLatency. This plays a brief sweep to measure latency.
delaySamplesMethod2 = measureLoopbackLatency(as)
delaySamplesMethod2 =
4527
release(as)
Frequency Response Measurement Results
Plot the frequency response.
% Compute FFT using the next power of 2 as length
FFTLen = 2^nextpow2(size(ir,1));
IR = fft(ir,FFTLen);

% Magnitude in dB of the first half of the FFT
IRdB = db(abs(IR(1:FFTLen/2)));

% Compute the frequency of each FFT bin and keep the first half
f = linspace(0,sampleRate,FFTLen+1);
f = f(1:FFTLen/2);

% Plot the frequency response (dB)
semilogx(f,IRdB);
xlabel("Frequency (Hz)");
ylabel("Power (dB)");
title("Audio Device Frequency Response");
axis([10 24e3 -20 0])
grid on
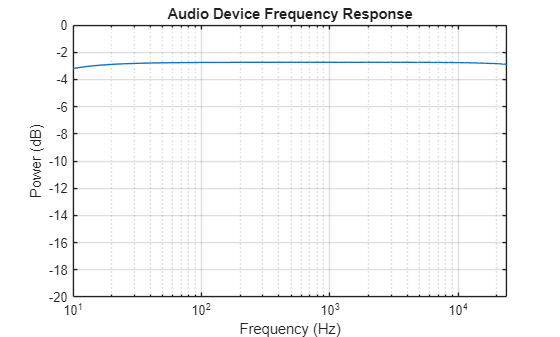
The frequency response plot indicates that the audio device tested in this example has a flat frequency response in the audible range (20 Hz to 20 kHz).