showDielectricSurfaceMesh
Description
showDielectricSurfaceMesh(___,Name=Value)
displays the
dielectric surface mesh, with additional properties specified by one or more Name-Value Arguments.
Examples
Read Mesh Parameters of Microstrip Patch Antenna
This example shows how to read mesh parameters of a microstrip patch antenna and view the metal, dielectric, and complete mesh.
Create Microstrip Patch Antenna
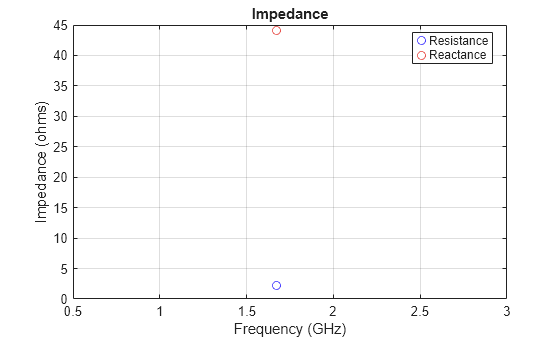
Create a microstrip patch antenna with copper conductor and FR4 PCB substrate. Run impedance analysis on this antenna at 1.67 GHz to automatically generate the mesh.
p = patchMicrostrip(Conductor=metal("Copper"), Substrate=dielectric("FR4")); figure impedance(p,1.67e9);
Read Mesh Parameters of Antenna
Read the mesh parameters such as number of points, triangles, and tetrahedra, maximum and minimum edge length, mesh growth rate, and quality using the MeshReader
object.
m = mesh(p)
m = MeshReader with properties: Points: [3x1644 double] Triangles: [4x2013 double] Tetrahedra: [4x4617 double] MaxEdgeLength: 0.0044 MinEdgeLength: 2.2012e-04 GrowthRate: 0.9500 MinimumMeshQuality: 0.0289 MeshMode: 'auto'
View Mesh of Antenna
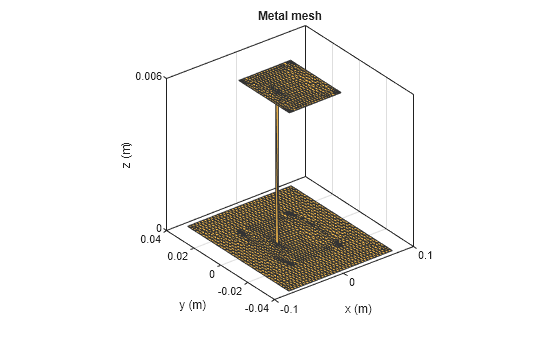
View the metal mesh.
figure showMetalMesh(m)
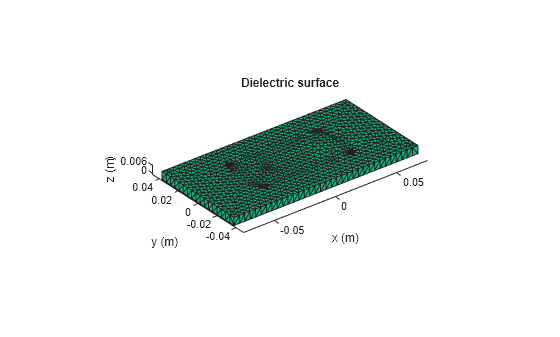
View the dielectric surface mesh.
figure showDielectricSurfaceMesh(m)
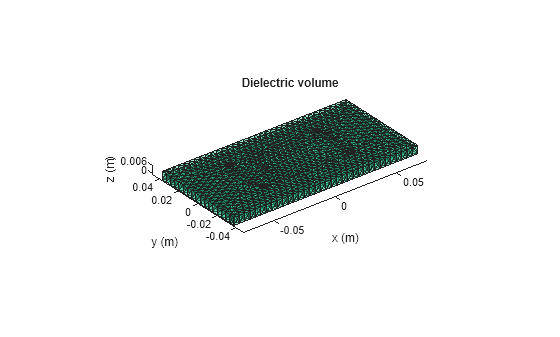
View the dielectric volume mesh.
figure showDielectricVolumeMesh(m)
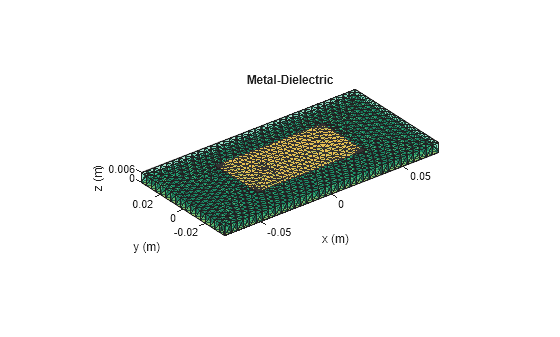
View the overall mesh.
figure showMeshAll(m)
Input Arguments
m
— Mesh parameters
MeshReader
object
Parameters of the mesh, specified as a MeshReader
object.
Example: MeshReader
object created using the mesh
function.
Name-Value Arguments
Specify optional pairs of arguments as
Name1=Value1,...,NameN=ValueN
, where Name
is
the argument name and Value
is the corresponding value.
Name-value arguments must appear after other arguments, but the order of the
pairs does not matter.
Example: Layer=1
Layer
— Layer number to plot mesh
positive integer scalar
Layer number of the dielectric counted from the bottom of the stack, specified as an integer scalar.
Example: 2
Data Types: double
Slicer
— Option to enable or disable plot interactivity
0
(default) | 1
| false
| true
| "off"
| "on"
Option to enable or disable plot interactivity, specified as
"on"
or "off"
, or as numeric or logical
1(true)
or 0(false)
. Set this argument to
1
or "on"
to open the plot with the slicer
panel, and to slice and view the desired cross section of the plot along the
xy-, yz-, and xz-planes.
Set this argument to 0
or "off"
to open the plot
without the slicer panel.
Example: 1
Example: true
Example: "on"
Data Types: double
| logical
| string
Version History
Introduced in R2023b
MATLAB Command
You clicked a link that corresponds to this MATLAB command:
Run the command by entering it in the MATLAB Command Window. Web browsers do not support MATLAB commands.
Select a Web Site
Choose a web site to get translated content where available and see local events and offers. Based on your location, we recommend that you select: .
You can also select a web site from the following list
How to Get Best Site Performance
Select the China site (in Chinese or English) for best site performance. Other MathWorks country sites are not optimized for visits from your location.
Americas
- América Latina (Español)
- Canada (English)
- United States (English)
Europe
- Belgium (English)
- Denmark (English)
- Deutschland (Deutsch)
- España (Español)
- Finland (English)
- France (Français)
- Ireland (English)
- Italia (Italiano)
- Luxembourg (English)
- Netherlands (English)
- Norway (English)
- Österreich (Deutsch)
- Portugal (English)
- Sweden (English)
- Switzerland
- United Kingdom (English)
Asia Pacific
- Australia (English)
- India (English)
- New Zealand (English)
- 中国
- 日本Japanese (日本語)
- 한국Korean (한국어)