Main Content

mesh

Generate and view mesh for antennas, arrays, and custom shapes

Description

mesh(object) opens a figure window and displays an already meshed antenna, array, custom geometric shape, or a platform. Here, the MeshMode is "auto".

Running any analysis function (impedance, current, charge, pattern etc.) on the antenna or array automatically generates the mesh which you can then view using this syntax.

example

mesh(object,MaxEdgeLength=Value) manually generates the mesh for an antenna, array, custom geometric shape, or a platform using the specified maximum edge length and displays it in a figure window. Here, the MeshMode is "manual" and you must specify the maximum edge length to generate and view the mesh.

example

mesh(___,Name=Value) manually generates the mesh for the specified antenna, array, custom geometric shape, or a platform using one or more name-value arguments and displays it in a figure window.

example

meshdata = mesh(___) returns a MeshReader object with read-only mesh properties. Use this syntax to see the details about the mesh parameters and quality.

example

mesh(shape,wavelength) generates a plot of meshed geometric shape at the specified wavelength in meters.

example

meshstruct = mesh(shape,wavelength) returns the mesh information (number of points and triangles) of the specified shape at the specified wavelength as a structure.

Examples

collapse all

Create a top-hat monopole antenna and run impedance analysis on it.

h = monopoleTopHat;
i = impedance(h,75e6)
i = 
2.4880e+02 + 5.9991e+02i

VIew the antenna mesh.

mesh(h)

Figure contains an axes object and an object of type uicontrol. The axes object with title Metal mesh, xlabel x (m), ylabel y (m) contains 2 objects of type patch, surface. These objects represent PEC, feed.

View the mesh properties.

m = mesh(h)
m = 
  MeshReader with properties:

                Points: [3×92 double]
             Triangles: [4×144 double]
            Tetrahedra: []
         MaxEdgeLength: 0.4295
         MinEdgeLength: 0.3221
            GrowthRate: 0.9500
    MinimumMeshQuality: 0.0660
              MeshMode: 'auto'

Radiation Pattern of Microstrip Patch Antenna

Create a microstrip patch antenna using 'FR4' as the dielectric substrate.

d = dielectric("FR4");
pm = patchMicrostrip(Length=75e-3,Width=37e-3,...
        GroundPlaneLength=120e-3,GroundPlaneWidth=120e-3,...
        Substrate=d);
show(pm)

Figure contains an axes object. The axes object with title patchMicrostrip antenna element, xlabel x (mm), ylabel y (mm) contains 6 objects of type patch, surface. These objects represent PEC, feed, FR4.

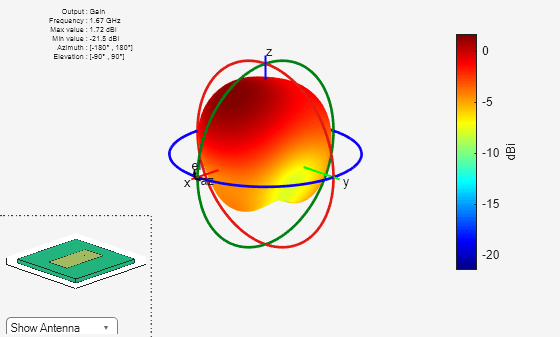
Plot the radiation pattern of the antenna at a frequency of 1.67 GHz.

figure
pattern(pm,1.67e9)

Figure contains 2 axes objects and other objects of type uicontrol. Axes object 1 contains 6 objects of type patch, surface. This object represents FR4. Hidden axes object 2 contains 17 objects of type surface, line, text, patch. This object represents FR4.

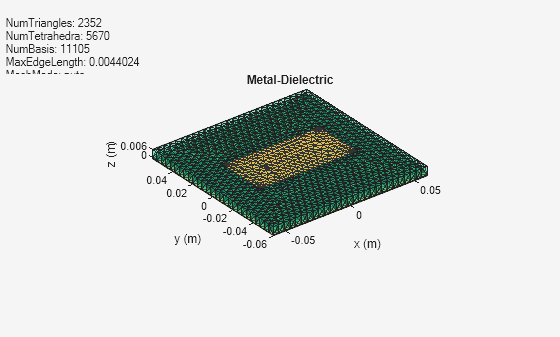
Mesh the whole antenna.

figure
mesh(pm)

Figure contains an axes object and an object of type uicontrol. The axes object with title Metal-Dielectric, xlabel x (m), ylabel y (m) contains 3 objects of type patch, surface. These objects represent PEC, feed.

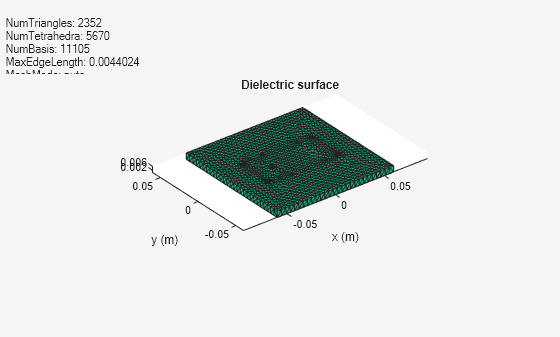
Mesh only the dielectric surface of the antenna.

figure
mesh(pm,View="dielectric surface")

Figure contains an axes object and an object of type uicontrol. The axes object with title Dielectric surface, xlabel x (m), ylabel y (m) contains an object of type patch.

Create a rectangular and circular shape, intersect them and mesh at a wavelength of 2 m.

r  = antenna.Rectangle;
c  = antenna.Circle; 
p = r&c;
mesh(p,2);

Figure contains an axes object. The axes object with xlabel x (m), ylabel y (m) contains an object of type patch.

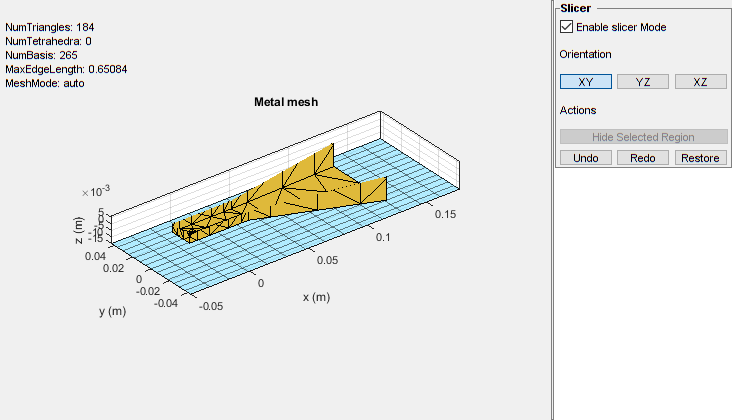
Create a default horn antenna. Mesh the structure with the Slicer argument set to "on".

ant = horn;
z = impedance(ant,70e6);
mesh(ant,Slicer="on")

Figure contains an axes object and other objects of type uipanel. The axes object with title Metal mesh, xlabel x (m), ylabel y (m) contains 2 objects of type patch, surface. These objects represent PEC, feed.

Select Enable slicer Mode. Then select a plane for the slice under Orientation.

MeshPlotEnableSlice.png

Click on the plot and select a region to hide.

MeshPlotRegionHide.png

Click Hide Selected Region to view the desired slice.

MeshPlotViewSlice.png

This example shows how to read mesh parameters of a microstrip patch antenna and view the metal, dielectric, and complete mesh.

Create Microstrip Patch Antenna

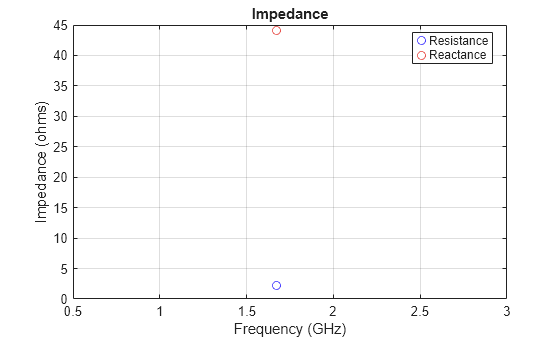
Create a microstrip patch antenna with copper conductor and FR4 PCB substrate. Run impedance analysis on this antenna at 1.67 GHz to automatically generate the mesh.

p = patchMicrostrip(Conductor=metal("Copper"), Substrate=dielectric("FR4"));
figure
impedance(p,1.67e9);

Figure contains an axes object. The axes object with title Impedance, xlabel Frequency (GHz), ylabel Impedance (ohms) contains 2 objects of type line. One or more of the lines displays its values using only markers These objects represent Resistance, Reactance.

Read Mesh Parameters of Antenna

Read the mesh parameters such as number of points, triangles, and tetrahedra, maximum and minimum edge length, mesh growth rate, and quality using the MeshReader object.

m = mesh(p)
m = 
  MeshReader with properties:

                Points: [3×1644 double]
             Triangles: [4×2013 double]
            Tetrahedra: [4×4617 double]
         MaxEdgeLength: 0.0044
         MinEdgeLength: 2.2012e-04
            GrowthRate: 0.9500
    MinimumMeshQuality: 0.0289
              MeshMode: 'auto'

View Mesh of Antenna

View the metal mesh.

figure
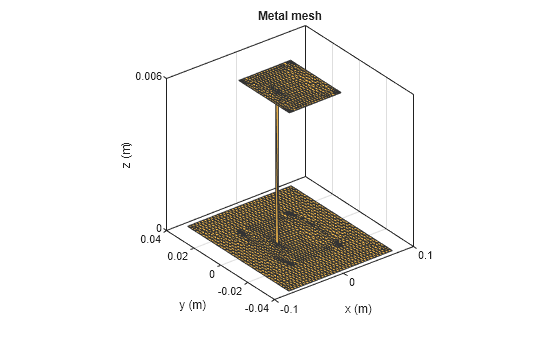
showMetalMesh(m)

Figure contains an axes object. The axes object with title Metal mesh, xlabel x (m), ylabel y (m) contains an object of type patch. This object represents PEC.

View the dielectric surface mesh.

figure
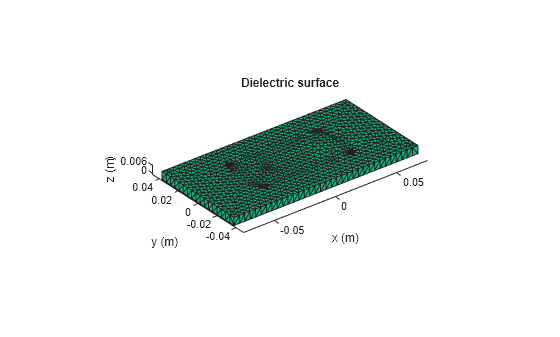
showDielectricSurfaceMesh(m)

Figure contains an axes object. The axes object with title Dielectric surface, xlabel x (m), ylabel y (m) contains an object of type patch.

View the dielectric volume mesh.

figure
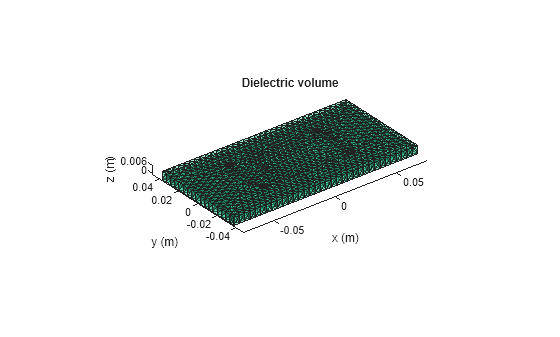
showDielectricVolumeMesh(m)

Figure contains an axes object. The axes object with title Dielectric volume, xlabel x (m), ylabel y (m) contains an object of type patch.

View the overall mesh.

figure
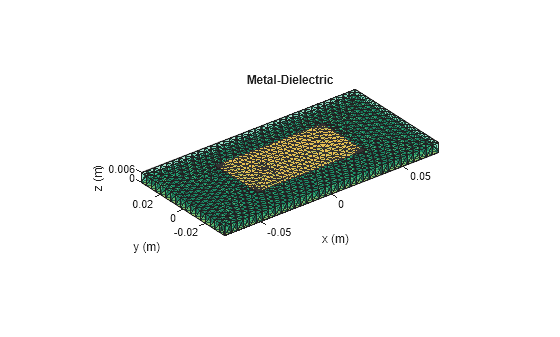
showMeshAll(m)

Figure contains an axes object. The axes object with title Metal-Dielectric, xlabel x (m), ylabel y (m) contains 2 objects of type patch. This object represents PEC.

Input Arguments

collapse all

Antenna, array, or custom geometric shape, specified as one of the following:

Example: dipole

Custom geometric shape, specified as one of the following objects:

Example: shape.Box

Wavelength to generate the mesh, specified as a positive scalar in meters.

Example: 2

Data Types: double

Name-Value Arguments

collapse all

Specify optional pairs of arguments as Name1=Value1,...,NameN=ValueN, where Name is the argument name and Value is the corresponding value. Name-value arguments must appear after other arguments, but the order of the pairs does not matter.

Example: MaxEdgeLength=0.1

Maximum edge length of triangles in the mesh, specified as a scalar in meters.

Example: 0.01

Data Types: double

Smallest edge length of triangles in the mesh, specified as a positive scalar in meters.

Example: 2e-3

Data Types: double

Gradation in the mesh triangle sizes, specified as a scalar in the range:

  • (0,1) for antenna and array objects.

  • (1,2) for shape objects.

Example: For antenna and array objects, GrowthRate=0.7 states that the growth rate of the mesh is 70 percent.

Example: For shape objects, GrowthRate=1.7 states that the growth rate of the mesh is 70 percent.

Data Types: double

Choice of the antenna or array element layer to view the mesh plot, specified as a string. Choose:

  • "all" to view the mesh of the whole antenna or array.

  • "metal" to view the metal layer mesh of the antenna or array.

  • "dielectric surface" to view the boundary triangle mesh of the dielectric.

  • "dielectric volume" to view the tetrahedral volume mesh of the dielectric.

Example: "metal"

Data Types: string

Option to enable or disable plot interactivity, specified as "on" or "off", or as numeric or logical 1(true) or 0(false). Set this argument to 1 or "on" to open the plot with the slicer panel, and to slice and view the desired cross section of the plot along the xy-, yz-, and xz- planes. Set this argument to 0 or "off" to open the plot without the slicer panel.

Example: "on"

Data Types: double | logical | string

Output Arguments

collapse all

Mesh properties such as the number of triangles, tetrahedra and basis functions in the mesh, maximum and minimum edge lengths, and growth rate stored in a MeshReader object.

Mesh information such as number of points and triangles stored in a structure.

Data Types: struct

Version History

Introduced in R2015a
See Also

Functions

Objects

Topics