streamline
Plot streamlines from 2-D or 3-D vector data
Syntax
Description
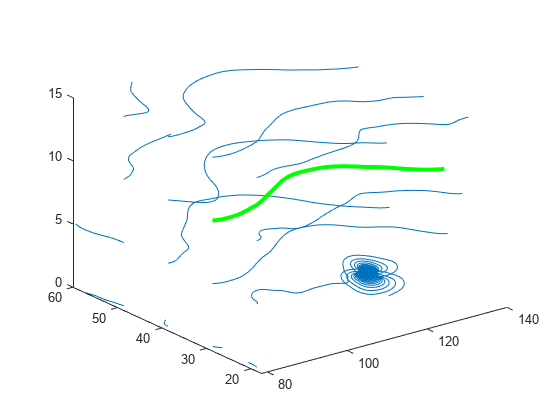
streamline( plots streamlines from
vertices, specified as a cell array of vertex arrays (as returned
by verts)stream2, stream3, or
streamslice).
streamline(___, plots
streamlines using the specified options, defined as a one- or two-element vector with the
form options)step or [step maxvert], where
step is the step size in data units for interpolating the vector data
and maxvert is the maximum number of vertices in a streamline. Use this
argument with any of the input argument combinations from the previous syntaxes.
streamline(___, sets
properties of the streamline plot using one or more name-value arguments. For example, you
can specify the color and thickness of the streamlines. For a list of properties, see
Line Properties. (since R2024b)Name=Value)
streamline( plots
streamlines into the specified axes, instead of into the current axes object
(ax,___)gca).
lineobj = streamline(___)Line objects. Use
lineobj to modify properties of the streamlines after creating them.
For a list of properties, see Line Properties.


