Model Monitoring and Drift Detection: Ensuring the Health and Fairness of Deployed Models - MATLAB & Simulink
Video Player is loading.
Current Time 0:00
Duration 1:06:34
Loaded: 0.25%
Stream Type LIVE
Remaining Time 1:06:34
 
1x
  • Chapters
  • descriptions off, selected
  • en (Main), selected
    Video length is 1:06:34

    Model Monitoring and Drift Detection: Ensuring the Health and Fairness of Deployed Models

    Discover essential strategies for maintaining the health and fairness of deployed models in this webinar on model monitoring in the MathWorks Modelscape solution. Key aspects such as fairness metrics, model drift detection, and resource management are addressed, showing you how to build dashboards and set up automated systems for optimal, unbiased model performance.

    The webinar can be divided into the following sections:

    • Introduction: The importance of model monitoring in ML deployments
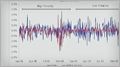
    • Key Components: Fairness metrics, model drift detection
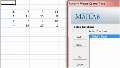
    • Dashboard Creation: Performance tracking, data drift, and resource use
    • Automated Alerts: Gathering user feedback and stakeholder alerts

    Published: 16 Feb 2024

    Thank you, everyone, for joining us. Just give us a couple of minutes while we let people come in, as we're seeing names popping in as we speak, and we'll start shortly. Thank you.

    Just give it a few more seconds, Paul. The number seems to be slowing down, and I think we can kick off.

    Great.

    I think you're good to go, Paul.

    All right. Thank you very much. I hope you can all hear me clearly and see the slides. Please use the chat if there's any technical issues with this meeting. And also, we're very keen to receive any questions. So you can ask questions in the chat using the Q&A app. We'll pick those up and look to address those at the end.

    My name is Paul Peeling. I'm a principal technical consultant at MathWorks. I've been at MathWorks for 12 years, focusing on the area of model risk management. And today, we would like to spend some time going over the topic of model monitoring, as we see it, focusing on two main areas, drift detection to ensure the health of models in terms of their predictive performance and accuracy and then fairness in terms of how those models can be demonstrated to not be biased and how those can be monitored on an ongoing basis.

    So this talk will be in four parts. We'll begin with just an overview of the typical challenges that are faced in model monitoring, specifically when the models are AI, ML models, and what we're seeing in the industry and the technology trends that we're using to address that. Then we will look at drift detection and fairness detection. So we'll cover some of the principal techniques.

    This won't be an exhaustive view, but it should be a good introduction to these topics for those who haven't seen this applied in reality. And for those who are familiar with these topics, we hope this will give you a sense of how these mechanisms can be then operationalized on real models. We'll then move into the practicalities in terms of instrumentation of your models and how do you then observe their behavior? And then we'll finally give some concluding remarks and pointers as into next steps.

    So if we move into the first section, model monitoring is critical for machine learning success. Actually, model monitoring is nothing new. It is very much a part of the existing regulatory expectations for model risk management. So for example, I've taken this model lifecycle diagram, this idealized diagram from the recent SS123 paper from the PRA. As you can see, 0.5 here, very much a key aspect of model monitoring, is called out here.

    Nevertheless, there are reasons why model monitoring itself is becoming more and more important, with the prevalence of AI and ML. The main reason is because these types of models are adaptive in nature. And the things that they are adapting to are shifting quite dramatically. So some of you will have been involved when models were going through-- I need to pause slightly because I believe I'm on slide three, but there may be a flag that others can only see slide one. You are on slide three, Paul, for me.

    All right. So I will apologize in advance. There's a couple of attendees saying that they are lagging behind on the slides. You'll have to bear with me. However, this session will be recorded. And so it'll be able to have access to it at the end. So we'll do our best. So apologies if my talking and my slides seems to be going ahead of what you're actually seeing.

    So just back on to this then, if, yes-- for example, in COVID-19, a lot of the original assumptions that were built into the models no longer held. And so the models, if the outputs were treated directly, they could have led to erroneous results and so on. So what then happens with these somewhat incorrect models or models that then were no longer functioning correctly? Well, they needed to be addressed.

    So a typical thing that happens with an incorrectly function model was an overlay was applied. So the model outputs would be then adjusted to meet the expectations, and there would be a lot of expert judgment. And SS123 again actually points out that institutions that start to have principles and processes around the use of model overlays.

    However, models are not separate from one another. And so if an overlay or an action is applied to one model but the upstream or downstream models are applied in-- the actions are applied in a different conflicting way, this can actually lead to a catastrophic failure of models there. And this is very difficult to observe when your view is over a single model.

    So one of the key things that I want to impress on you is that changes to models and adjustments to models should be done in a timely manner and on an ongoing basis. Monitoring is not necessarily some periodic revalidation of models, but it needs to be done on an ongoing basis to avoid an adapt to these changes that we have seen practically in models.

    Some of the things that we can observe about models are fairness metrics and drift detection. And we're also starting to see these come about in regulation. So one of the earliest papers was from the monetary authority of Singapore, their feet principles, which talks about fairness, ethics accountability, and transparency. And now, these are being fed into the other the regulators. So we're seeing the AI Act in Europe and increasing focus from the fed in the US on addressing the key challenges around using AI and ML models for these applications.

    I found this particular picture very helpful. So this here is a set of pillars from an EYY whitepaper about the value of trust in AI models. The key central principle is responsible AI, but then around the outskirts are these various areas. So in terms of today, we're not going to cover absolutely everything around the circle, but we are going to look specifically at model performance.

    So this pillar here-- oops, sorry, my pen's not working properly as expected-- so this pillar here and also the bias. So these top two pillars here. So the model performance will address through data drift detection and the fairness addressing to confirm that models are acting unbiased.

    Practically, organizations are building up dashboards to enable them to see what's going on in their models. And these dashboards are now principally becoming real time. So one of the things I think is useful about having a dashboard is, because it's an early warning system, you can start to look at model performance. And the earlier you are flagged and have an understanding of issues of model performance, the better.

    These dashboards are also not just for a single model or a single team or business function. They're usually shared across the business. And so this can facilitate planning and redevelopment of models. And if you recall, a couple of slides ago, I was talking about the problems associated with uncoordinated issues and actions. And these dashboards, which bring together information together in one place, enable you to see issues associated with not just individual models but group of models can help address that.

    And then finally, these dashboards can also help progress tracking against key risk indicators and against milestones. So you can embed these into your overall model risk management plans and activities. Then the last point is then dashboards are all very good if someone is watching them. What if nobody is watching them, you're not actually looking at the dashboards? Then you also need ways to automatically alert the required stakeholders or whoever's going to make the changes so that action can be performed.

    So we'll later on cover systems enabling you to create automated alerts and how to then create interventions on those alerts as well. And we'll dive deep into this diagram on the right hand side that shows you a fairly common DevOps-driven architecture for running models, collecting the results, and then providing them to the downstream processes that need to create the alerts.

    And the alert system should not be solely concerned with the production of the alerts, but it's also the consumption of the alerts. So we need to look at how alerts from monitoring-- and again, alert will be, for example, a model starting to demonstrate bias in its behavior or data drift. These alerts then should be handled in both the governance and development process.

    So an alert that would go to governance would be, for example, an issue in a model that can't immediately address the needs and overlay activity to be performed or some other model remediation. A development process may be a trigger to recalibrate or entirely redevelop a new model, or both of those could happen at the same time. But these are the ways that the alerts from model monitoring then complete the model risk management lifecycle to ensure that models retain their performance and are up to date.

    So that was my introduction. I hopefully impress on you the importance of model monitoring and the importance of thinking about model monitoring, not just as a periodic activity but a regular, ongoing process that can then drive alerts in order to improve your models.

    Now, I want to take go into the second part of the talk where we're going to talk specifically about two, and only two aspects of models that can be observed that can help you improve the trust and responsibility of your modeling. And they are drift and fairness.

    So just as an overview, actually drift is quite a lot of different things there. The general idea is that drift is something that has been observed in the past no longer holds for the present. Usually applies to the data that the model is running on because most models that we're talking about are data driven. If you're looking at the literature for drift, you'll spot that some types of drift are things like instantaneous or sudden drift, as it's called in this particular paper, or more incremental, gradual drift there.

    So you can see that drift isn't necessarily a sharp point in time that you can determine. However, there are various rules that you can apply to these graphs in terms of thresholds, either an instantaneous threshold, which might look a bit like this straight line down here, or maybe a ramping threshold, which looks at the gradient of these things here. These are various ways to define drift. And we'll look into more detail at those later.

    And then the other aspect we're going to look at is about fairness metrics. And the way that this works is that we then look and divide models and observations of those models into various groups. So here we've got group A and we've got group B. Now, an observation on a model is a very impersonal way of saying it's a decision made about a human being that affects, in this particular case, their credit worthiness.

    So group A will be perhaps the majority, and group B may be a minority in a sense that they may have a protected attribute, whether it be gender, race, sexual orientation, and so on like that. These are all protected attributes. And the way that the model decides does that one go into group A or group B is something that can be measured and determines whether or not it is an aspect of the model demonstrating biased behavior.

    So let's dive in. So I've chosen for the first aspect, drift detection, looking at a typical data set. So you can see in MATLAB here, this is the New York CITY house sales for 2005, I think. And it's a fairly typical data set. You can see very typically, you've got-- the columns refer to the observations. Each column is-- sorry-- each column is a variable. Each row is an observation. And in these sense here, there's some categorical and there's some numeric variables there.

    But this column here, the sales date, is actually a date-driven variable. And therefore, every time that there's an observation here, that changes over time. If you're going to build a machine learning on this model, you would typically take each row at a time as an observation, and you will ignore the sales state.

    And that would be fine as a starting point there, but if the distribution of these other variables changes over time and the only indication you've got sales date, then this model is susceptible to drift. And this is a super common data set and a modeling technique to use.

    Just finally, we're going to binary predict whether or not this property was sold based on these input datas, ignoring the impact of sales state over time. So that's just for the data drift. We will first train a model, and then we'll observe what's going on with that model and then we will finally perform a corrective action on that model to restore the performance. This is a very easy way to set up a data drift and to study this particular problem.

    So I'll go through this three-step formula over time. So you'll see it practically action. So what I'm going to do here is going to open up, load up the model into an app that we have called the Classification Learner. So this Classification Learner app will take in the data set, the NYShousing2015. It will apply best in practice techniques such as cross-validation to avoid overfitting.

    We'll look through the predictors. And as I said before, we're going to assume this model is stationary. So we'll remove the sale price variable. And as you can see, the app has already determined-- sorry-- the sale date variable, the sale price variable goes into the sold variable. So we'll also remove that as well. And [AUDIO OUT] sold is the binary variable.

    So here, we can look at the distribution of the data, but this all assumes that the data sets are constant over time. We'll build just a simple decision tree on this model. Nothing fancy here. And we'll get out an accuracy of 73% on this binary variable Yes, we can improve this model, but the purpose here is just to arrive at a very quickly, at a simple model there that has some positives and negatives that we can measure over time. And then we'll take that model, and then we'll perform some further analysis on it.

    So the analysis that we're going to perform in this model is that we're going to take the accuracy of that model. Recall that the accuracy of that model is whether or not the model predicted correctly or that that house was going to be sold on that date. And as you can see, it's quite a noisy signal. So the housing market is not that predictable, but there's a clear trend. And what I've done is I've taken all of the individual observations outside of the training data set, and I've just grouped them by week.

    And you can see here, that's the 73% or so that we started with. The model continues as in here. And then potentially, it looks like we've got a bit of a downward trend over time. Now, you can measure this clearly. So for example, you could have decided, right, I will put a threshold on the original performance accuracy. Hey, it's hit the threshold around here. At this point in time, I probably then need to include all of this additional training data that I've observed into my model.

    So that's a very simple strategy which we call incremental machine learning where we add new observations of data into a model to counter for the fact that the original data way back here, may since have become less relevant. There's other things we can do in this process, and I'm not going to speak about all the methods of incremental learning, but we can also apply weighting.

    So in fact that the actual the relevance of the past data sets here is lower. So you essentially say that I'm going to weight the higher observations more recently. These are all parts of the approaches that you can develop and design strategies for. Having done that then, let's have a look at the results.

    So I did one of those here. And so this new line here, the orange yellow line, is then the updated model, which I've run over the same data here. Recall around this sort of point here was where that I'd decided that the model drift was too much. It had gone over my threshold. And so I was going to retrain the model. And without too much rigor, you can at least see that then we've seen an uptick later in the actual accuracy on this model immediately, and it's preserved it over time.

    And so when you're looking towards the end of the year, this corrective action applies in week 40 has resulted in that the model performance is actually be sustained and is roughly at the level it was originally and is less susceptible to data drift. So this is a very simple example. It's simple in terms of the analysis we've performed. We've just basically looked at the accuracy and then made a deterministic rule to then retrain the model. And we simply included new data set observations in that model.

    But nevertheless, the workflow is quite important. And I'll remind you, it's this three step workflow. We defined what we're going to measure. So in this case, we were measuring the accuracy of the model on its binary classification to decide whether or not this model is predicting the output correctly or not. We decided, point two, on whether or not the condition was violated.

    So when the accuracy of that model dropped significantly below 73%, we decided we're going to retrain the model. And the third point is then we retrained and redeployed that model, and we saw a corresponding improvement in model performance.

    So that was the sets of workflow and actions we performed, but why did this happen? Why did that model drift over time? Well, we have plenty of analysis tools to help us understand in detail the causes of model drift and what to do about it as a corrective action. And we can be more refined than what I just did, which was just to bring in lots of new data in order to weight more recent observations.

    So in terms of model drift detection, there's a lot of attractiveness to model drift. My first point here is that you can calculate model drift as soon as you see the input observation data. You don't have to wait for the final output to be observed, which is great. So why is that important?

    So in this particular case, we looked at housing price data. The sale of the house may be weeks or months later than the actual data that's measured, or in a typical consumer credit model, if you're looking at the probability that your obligor is going to default, that default may happen months or years in the future. You never observe it, yet the inputs to that model stay the same over time.

    And so you can use model drift immediately every time the model is run, irrespective of whether you've observed the actual output there. That's a very attractive thing. That means that you can take any model that you have, start measuring the model drift and start to monitor its performance. I'm not going to use mathematics to describe exactly how you can calculate these, but I'm going to use some explanatory visualizations just to give you the idea of how it works.

    So we are going to look particularly at a single predictor in the model. So in this case here, this was the sales price variable, here. Now, the way that these drift metrics do is they take the variable, and they will bin it. And the number of bins and so on like that can be determined automatically, but the binning here then leads to a distribution. And this distribution can be measured for the baseline and the target.

    So I haven't defined baseline or target. So let me start. What does baseline mean? Baseline typically for a model refers to the data set it was originally trained on. So in this NYC housing data, it was the first three months of observations in 2015. Target, on the other hand, refers to a more recent set of observations. So in that case, maybe the last month of observations or the week when I was aggregating that over there.

    The baseline and target data sets have both the same set of inputs, and the hypothesis for data drift is just saying that the baseline and target distributions are the same. That there's no obvious difference between the two there. And you can compute this here. And you can see, in this particular case, there is a difference. So the blue and the red have a difference. The zero point for sales price is heavily weighted by the fact that the house wasn't sold.

    So there's a lot of observations in this zero bucket. And you can see in the red target data set, a higher proportion of houses were sold than in the baseline. And that distribution of data from this target data set has ended up here. And you can see that this area between 2 to 10 has increasingly weighted their.

    So you can then observe for this sale price variable, you're seeing a drift there. And you're also seeing some of the characteristics of that drift. And then maybe attempted for this model to say, well, what happened? Why did more houses get sold in this target period than in the baseline?

    Another common visualization which is a little bit easier to see is just mapping it in a continuous manner. This is an empirical cumulative distribution function, but it shows the same data as before but mapped continuously. And you can see here again the decrease initially of the number of sales, and then it increases for the target variable here. And this function is actually used to then compute numerical values for data drift as in this p-value here.

    And that p value is for a particular predictor, is that number. That's the number that you want to be monitoring. And if that p-value then drops below a certain amount, you have an indication that the model has drifted for this particular variable.

    Another visualization which is helpful is to look at these things over time. So in this particular graphic here, we have the same thing, where this variable observed over time, and we also have confidence intervals. So this means that, although the actual value is this value here, we're fairly confident it could actually be between these lower and higher values as you can see in the bands here.

    And also, when we operationalize this metric, we usually have two thresholds. We have a warning threshold here, which is a higher value, and then a drift threshold here. So the warning threshold can be used to at least alert and say, you should probably review this model. We don't have a guarantee that this model is drifting yet, but it's certainly falling into an amber category. And a lot of moderate management or validation functions do have this red amber green status of looking at things.

    So that fits very well into operationalizing data drift. Whereas down here-- and you're not seeing it for this model, but if the p-value went down here, you would definitely start to see a real drift taking place here. And you should act upon it. And you can see in this particular example, though, those are warning the model, then seemed to go back into the original set of acceptable values there. So this would have been treated as a false alarm for that model.

    So that was some of the mathematics and computation involved with data drift detection. I'm now going to switch over to bias, and then we'll talk about how systems can be set up to actually monitor these models, create these alerts, and feed back into model management. But let's talk about bias.

    So bias is, as I described earlier, is the concept where a model is discriminating against a population that it's running against. And it could be quite pernicious. It can really be introduced in several ways that may be unexpected. So on one sense, the bias can result because the input data that we selected for that model had the bias in it in its first place.

    So what we often see when models are built is that the model was built on a training set that was already biased. For example, if a model is built for credit scoring and that credit scoring automatically penalized by neighborhoods and that could be associated with protected variables, the model is simply going to reinforce that. And therefore, just selecting from the data set will probably lose some of the richness in that data set to say, well, actually these protected population could have performed better on that loan.

    Another aspect is just simply the data volume. If you've taken everything and have an adequate data volume there, the bias may already be in the data set, and you wouldn't have been able to just eliminate it simply by increasing and sampling more data there. So this behavior bias is in the behavior of the system. This selection bias is in the selection of the training set. So big data, increasing volume doesn't solve this bias problem.

    And then finally, the model structure itself may be biased. So you'd be able to select a particular model structure that performs well. However, that model structure may indeed have certain places where it performs well overall, but it doesn't perform well for particular-- some of these protected attributes there.

    So in these senses, all of these things are aspects of models that should be reviewed before the model is approved. So model validation teams need to be looking at models. They need to understand these forms of bias, and they need to understand how model developers have measured this bias and addressed them as well. Again, we're talking about model monitoring here. Just a quick check. I see a flag. Can people still see me and see my slides and it's just a one person?

    Yeah.

    Good. I'll keep going. Thank you. I'm only going to talk about the measurement of bias and the measurement of bias that can be operationalized. I'm not going to talk about exactly how models can be built to be unbiased. But knowing that a model is biased or has become biased is certainly the first part of that story.

    So we bring into this concept of fairness metrics. And these are key for either ensuring that model outcomes aren't bias in the first place or continue to be so. And there are two general types of fairness metrics that are applied. The first type of metrics is demographic parity. So what this effectively means, the thing that we're predicting, so in this case for example whether or not they would default or not, has no relationship to the thing that we're worried about. So in this case H.

    So for the model I've been looking at for this case study, the data set itself has been selected carefully to preserve this independence. You can see this on the chart because you can effectively see the reds and the blues, not exactly but are roughly in proportion for each bin there like that. So this particular data set and the way that the model has been trained illustrates demographic parity.

    So irrespective of your protected attribute, the prediction that this model makes is unbiased. And that's something that then can be measured. So if your data set drifts, for example, not only may you spot it with some of the previous data set drift detection mechanisms we talked about, but also, it could be measured through demographic parity.

    The other broad category of fairness metrics is around the odds, the equality of odds. So in this sense here, it's not that the predictor is completely independent of the protected attributes, such as age, but it's conditionally independent. What that means that, all other things being treated equal, the person who is being ranked by this model there has an equal chance of a default or a non default based on their age their.

    And this is a property. You can actually enforce a model or some types of models to obey. And so in this case, data drift wouldn't affect this type of model. You can see on the chart, not very easy to see in this particular graph, but what it's showing you that, although that the distribution of the reds has changed there, they're actually still conditionally independent. So this can be measured through some other metrics that we'll look at there.

    And as I said, if it's into the model structure, data drift can't necessarily change this property, but if there is a drift in these equality odds metrics, it can indicate that there are other structural changes going on. So for example, other factors or risk factors are coming into play that the model hasn't been trained on. And so you then say, well, OK, the action related to this is to increase the width of the data set that this model is observing.

    So this visualization doesn't show equality of odds. So the way it can be shown is through these charts here. It's quite similar to interpret as a data drift. I have two models, got an SVM and a generative additive model-- generalized additive model, sorry-- and the various predictors here. And then they're weighted individually per feature. Again, so in the same way of data drift, you can operationalize this by choosing a threshold value and then deciding what to act upon, given any of those threshold changes.

    Now, there are many different metrics. And one of the key challenges around fairness metric is what to choose. I'm not going to offer too much advice here. Just to give you an idea that for particular metrics exist. Here, you can choose any of those and measure them and incorporate all of those into your monitoring frameworks for all of the protected attributes that your models are running on.

    So in the same way as with the data drift, there isn't really much stopping you from starting to incorporate fairness monitoring into your model execution platforms. The only difference between this and data drift is you need to start to identify what are your protected attributes and also what is your policy for dealing with those. Do you choose to use the demographic parity approach or do you choose to use the equality of odds approach?

    I'll move on to the second part of my talk, which is about then, how do we take these models in production and instrument them and then start to alert on those spaces there? So this is some MATLAB code that we have that can be used to instrument models. So the key point here is that you can always-- in many frameworks, irrespective of your language, the instrumentation can be performed by the model as part of the design.

    So in this case here, my model, is just some examples here, has created some-- what we call metrics that can be measured. Your platform can usually support different types of metrics. So we have counters and histograms, and these correspond to the numerical values of metrics for data drift that we were talking about in the previous section. And then when you come to run the model, you then need to basically say, where am I going to send my metrics to?

    So you effectively point to a database. And when you're running the model in development, you can point to a simple test database. And then when these models go into production, you need to change the URL of that database to point to the production database. But it's reasonably easy to set up models in order to then automatically start to produce measurable data that can then be used to define alerts in there. And this can all be done even before the model has been approved and deployed into production.

    So when you instrument your code, like this, you will then be able to observe it in one of these databases. So Modelscape, which is the model management solution by MathWorks, supports various database backends for producing model metrics. So this particular one is Prometheus.

    This is a time series database. And as you can see, the single value that I'm looking at here, for example data drift, is being measured over time. And so I can drill down into this. I can see it, and I can observe it over time. And I could also correlate it with other aspects of the model there.

    Now, you can see here that this measurable is still quite noisy. So if I was wanting to put a threshold around here, I might get some-- oops, it's moved now-- it might go up and down here. So I actually need to then take this value that I'm observing and smooth it. And so we can then quite simply decide how are we going to smooth this. So in this case here, I'm going to take this. I'm going to compute its average over time over the last five minutes. And that's the purpose of this data set.

    So we can support these smoothing operations and define how are you going to smooth it over what time period. And you can automatically look and see and verify, OK, that looks pretty good. And they can obviously then start to put a threshold around the peak of this signal here. So being able to interactively query your data that's running on a model and then decide, well, what are appropriate thresholds to be running on this is very important.

    And ideally, you should be thinking about the monitoring of the models and how these thresholds are going to be applied in actions while the model is being developed. You shouldn't need to wait until production and a problem to occur with the model before determining what these are here. So this is key that while we're in Modelscape, we bring all of these tools up to the model developers and validators so they can experiment and they can work with these systems and alerting before the model actually goes live.

    And then when we actually build the alerts, it's fairly simple then. We would just basically put a threshold there. This particular one, you can see there's flat alerts here over time, but you can also decide to either differentiate the smoothed signal and generate one of those ramp alerts, which is helpful for incremental data drift, or putting in a ramping and alert there. And so all of these systems can support that there.

    And then, you also need to decide what to do about that as well. So we will then decide when the alert happens, how should we handle that and where should we send notifications to. So alerting isn't the end of the story. The last part is what happens to the alerts in model governance and model development but also you need to think about the existence of false alarms and multiple alerts firing of the same time.

    And so things to look out for and start to develop strategies around are grouping. So if you're getting lots of alerts of a similar nature, then you should group them ideally into a single alert. So an example from what we've been looking at is imagine if your entire model data had shifted, then you would see alerts being generated for each predictor in that model. It makes sense to group all of those alerts by the model and not see independent alerts for at each predictor.

    The second one is that these systems, you need to suppress them if other alerts are active. So if you already know about something, then you don't want to continue receiving alerts and kicking off new processes to respond to those alerts if you're already in the process of acting upon those.

    And then the final one is then being able to silence alerts. So you should be able to take an alert and decide, I'm not going to do anything about this for the next week, month, or whatever period of time they're to notify an action that alert has been seen and is being acted upon, but the alerts should not then continue to be raised in that system there.

    So again, these three areas need to be considered. And especially in the grouping scenario there, if you're looking at alerts across multiple models, you need to have a more holistic view across all of your models and not just handle each one of these independently.

    Another aspect is that the alerts and the performance may not just be from the measurable things that we defined in our instrumentation. We talked about defining and measuring fairness and drift detection quite extensively in the first part of this talk. However, there are other things that can impact the model output that you may not be thinking about right now.

    If this model is a really busy model, it's meant to work in real time, it often runs quickly. Is there a sense in which-- how utilized the machines where this model is running on can affect the output of the model? Maybe there is. If it's kind of a simulation model and that model is cut off after a period of time, then the amount of time that model takes to execute has a direct impact on the output of the model there.

    Another sense is that if the model execution is delayed, then you may not see the results of the alerts until later down the line. And so not only do we talk about looking at the numerical values that are defined in model development validation, but we also need to bring in information about production systems where these models were looking on.

    So in this case here, when we're looking at the time series data set, there's this spike here. Did that spike have any relationship to the impact? Was that spike resulted in an alert or not? So to do this, you need to then combine the instrumentation of the models themselves that is basically done by the model developer, as I showed you in code, in terms of their features, the calculating data drift and fairness, and aspects of the model input and output, but in addition have instrumentation that measures how long it takes to execute the models. How long does it take to get data in and out of the models from a database? And so on like that.

    And that forms part of a larger DevOps infrastructure that actively monitors and measures the properties of all of these models as they're going on over time. So as a model developer responsible, you can create the instrumentation for your model, but you also need to work with someone in your organization on the DevOps side who can give you a platform to run those models and include all of the other data there.

    They will then feed all of this data into one of these telemetry backends, I was showing Prometheus before, and you should therefore be able to query that at any point and get some operational idea about how your model is running. But to achieve this with AI/ML models in real time, you need to start thinking about an entire DevOps infrastructure for your running your models. And for MathWorks, we provide model scale, which is an out-of-the-box solution for doing that for any of these types of models here.

    So just to conclude on that, in terms of integrating the user feedback, we looked at the observability of models. So this is a terminology that is well understood in DevOps which says that you've got a process, and you're able to numerically observe outputs of that, that combines the instrumentation plus the telemetry data that is collected there.

    And so your DevOps teams will be able to run and monitor your models for you, and then the output of that will then go back to your business users about specific models and the model developers. And that will depend on how you've defined to implement that in your model governance and model development procedures.

    And so I'll briefly close on then how do we actually achieve that with Modelscape, is that, again, if you're looking at Modelscape, one of the attributes of Modelscape is then to look at all of the models across your organization be able to create those dashboards that we were looking at earlier. And you can get an overview of all of the models here but also then drilling down into specific models here such as this model here. This system can be populated with alerts directly that have come from the monitoring system.

    So this model has been configured to raise findings both from the validation perspective for models that are under approval but then any alerts that have come in from that model there, and then they can be actioned upon in the same place so this action can then have a creation date, a severity assigned, which could be automatic or manually reviewed, and then they can be tracked through your model governance processes deciding on whether or not to overlay that model or whether or not to trigger a new redevelopment of that model.

    So as I said right at the beginning, model monitoring is not simply an activity in isolation. It feeds back-- provides feedback from your models to the governance and development processes to improve the overall performance, relevance, and fairness of your models.

    So in conclusion, MathWorks, we've built a Modelscape that addresses many of these challenges that we showed you today. And you're obviously welcome to take all of the learnings from this talk in terms of how you apply fairness and drift to metrics, but we're providing that out-of-box for your model types. And principally, this is in the Modelscape monitor component there, where you're able to create thresholds and alerts.

    You can create the dashboards to look at the results of those models, and then you can analyze the model usage to decide what to do with those there. And then that feeds into both the subsequent development of the models to refine and improve those models based on the data that has been collected by the models running in production and also on the governance side to decide whether or not to overlay those models or to retire them and what to do with operational issues that are encountered.

    Other aspects of Modelscape are the support other parts of the modeling life cycle. My slides seem to have frozen. Sorry. What it says on that? There we go. Sorry. The ability to validate the models in a live environment, the ability to then automatically test those in pre-production, and then to deploy them as well. But the overall concept, if you're using Modelscape or you're using other platforms, is that this model monitoring needs to form part of a holistic overall strategy for handling these models.

    We've done some studies on understanding not only the value from a risk management perspective but also efficiency perspective of adopting such a model monitoring strategy, as I covered today. So you can save time in both creating the dashboards automatically, creating the alerts and the triggers and the automatic tasks, and then being able to monitor those models over time. So as you can see from these slides here, you can get some substantial improvements in efficiencies versus doing things the traditional way through adopting a solution such as Modelscape Monitor.

    And I will conclude just by letting you-- just repeating roughly what we looked at today. Looked at two main areas in terms of using model monitoring. We looked at the specific examples of drift and fairness detection. The reason we chosen those is these can be applied at fairly low cost to most of the models today. And they are important. They can be measured continuously, and we can measure them automatically.

    And so we gave you some high-level techniques that you can use to apply those and start to define thresholds and alerts. Then we looked at the concepts of instrumentation and observability and reinforce the fact that model monitoring completes an end-to-end workflow that starts and links in with model governance and development.

    And to get the best efficiencies and gains out of this DevOps-powered solutions such as Modelscape can really help you on this journey to model monitoring. And with that, I'd like to thank you for your attention. And hopefully, we've got a few questions in the audience that I can a have a quick look at and maybe address.

    Right. So Paul, does this question asking for the difference on data drift and model drift, if these are two different concepts?

    Yeah. So they are different concepts. For example, data drift can be measured independently of the model itself. So you can look at the drift in a data set and decide whether or not that distribution is changing over time. You could even use this when you're deciding whether or not to build a model on that data set in the first place. So you can monitor this data set using these systems. If that data set is continuously drifting, there's really no point in building a model.

    An example of model drift would be the case of where-- we looked at the quality of odds. And in this sense here, a drift in the quality of odds would have indicated that a new variable, a new risk factor was in existence that hadn't been captured by that model. So something that was affecting the distribution of that model. So that's a choice of model selection on that data set, not on the data itself.

    There's another question there. Is there a limit to the number of model metrics we should be observing? Do you think there are some rules of thumb that should be applied to thinking about the number of model metrics? So there's no harm in observing as many metrics as you wish. Most systems are now built to handle that with scale. And certainly, when you're actually going in and performing diagnostics and analysis on an alert, you should therefore be able to get access to as much information as possible.

    However, I wouldn't recommend creating an alert on every single metric because that can really increase the amount of noise, increase the number of false positives, and so on like that. So you should only be creating alerts as part of your model validation procedures to decide which things do I care about the model that I want to then cause a recalibration revalidation or other action on there. They should be very much limited to anything that you can provide a governance procedure around.

    So handle the alerting with care, but there's no harm in measuring as much as possible about models, especially when the measurements can be effectively produced for free automatically based on the model type.

    All right. Thank you. Do you have examples of other model monitoring metrics we should be looking at?

    So you should initially start with everything that you've ever created a validation metric for. So there's a whole host of validation metrics around model stability, sensitivity analysis, stress testing, all of these techniques that apply to models that you've been developing for years, irrespective of whether or not they are AI or ML models.

    So absolutely do, continue to use those. And because these are numerical, they can be calculated easily. They can be easily added to your instrumentation. I guess my purpose for showing fairness and data was that these are especially prevalent and interest for AI and ML, but there are many other metrics that you can work with too.

    Well, I think there's a question that follows up on it, which is do you have some guidance for defining the metrics? Think you've answered it partially based on what you explained.

    So certainly, there's plenty of out of the box definitions there. I think one of the areas where I think the whole industry can start to work on improving is, once you've got these metrics and they're to hand, learning what to do with them, which is why I'm proposing and promoting that measurement-- building up an environment where you can measure and observe your model's behavior can be done well in advance of even the model being finalized or deployed and ready for production there.

    So you can gain insight and experience over those. You can also then start to, having collect all the metrics and alerts in the past, start to simulate and decide how many times would have an alert fired for this model over the last three years that it was being run, even though it wasn't being start to do these studies as well. So getting a much better organizational handle on how these alerts can add value to you.

    Right. Thank you. I don't see any other questions. How do you determine the thresholds for the model matrix?

    So a simple way is just the statistical analysis decides, well, how often could you determine an alert for those there. There are ways, if you look in the literature, you can define specific alerts, but really, it boils down to your risk appetite. The analogy is if you've ever worked with market risk models, for example, you need to specify the VAR value. Is that VAR at 5%? Is it a 1% or so on? Like that all of these metrics have a similar concept of an overall risk value that you can choose and you can pick that threshold and use that.

    All right. There's one question here. Does Modelscape test or deploy allow us to test compile code? Is the recommended approach for testing compile code? The person recently found out a corrupted MATLAB path often leads to unusual issues with the deployed code.

    So Modelscape works with all models irrespective of whatever language they are, so MATLAB code, Python code, code generated from MATLAB models, and so on like that. The code is always deployed into a microservice. So effectively, it's independent and can be independently run and tested even on developer's desktop or on a production system like that.

    Can you determine-- you can certainly use the principles I've shown here to determine issues with your model structure through backtesting because you set up a backtesting run. You look at the metrics, your result you're looking at and decide, oh, look, that's not giving me the right metric values. It's not just the right outputs for the model but the metrics that you observe over time as well. And that's a useful testing mechanism. And yes, in our test component, we do support automatically running and measuring these tests.

    All right. Thanks. So there are a few more questions. Can we validate machine learning models using this?

    Well, yes. So this is part of the validation of machine learning models, but monitoring is actually a function of model validation overall. So I'm talking, at least for the focus of this talk, talking about the post-production monitoring and what you can do about those, but all of these techniques that I'm talking about are agnostic of the type of model that you're looking at. They typically focus on the inputs and outputs of the models and will work for machine learning models traditional models and all of those. And they can be compared against each one.

    Right. How can one build a model-monitoring framework for ML models in predicting values at future time periods, for example, credit default rate of a customer segment at 1, 2, 5, or 10 years into the future?

    So I guess that's out of scope of this particular one here, but you could certainly take the measured data distribution, assuming it's not going to drift, which it will, and then project and build a forecasting model there. But that's really going to-- I mean, that's part of the forecasting that you do with the model you'd expect to have. So I don't think you could do that. You won't get very much insight into that because you're not going to use anything other than the model that you're already proposing to work with.

    Right. Don't think there are any further questions. And we are at the hour. So I think--

    That's great.

    Thank you.

    So thank you for the questions received. Thank you for the time spent in hearing us talk about this topic there. So there will be a follow up there. So we'll certainly share the recordings and the slides so you're able to access those there. And then, obviously, we'd love to hear more from you for feedback in this presentation.

    And if you're interested in talking to us about using Modelscape or any of the techniques that we've been expressing here to work with your models and get them into production and monitored, then we're very happy to have some further follow-on conversations from this. All right. I think with that we'll be able to close the session. So thank you very much.