MATLAB Tools for Scientists - Introduction to Statistical Analysis
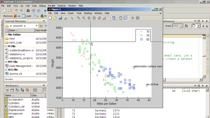
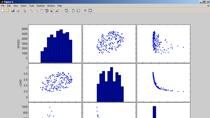
Researchers and scientists have to commonly process, visualize and analyze large amounts of data to extract patterns, identify trends and relationships between variables, prove hypothesis, etc. A variety of statistical techniques are used in this data mining and analysis process. Using a realistic data from a clinical study, we will provide an overview of the statistical analysis and visualization capabilities in the MATLAB product family.
Highlights include:
• Data management and organization
• Data filtering and visualization
• Descriptive statistics
• Hypothesis testing and ANOVA
• Regression analysis
About the Presenter: Asawari Samant is an Application Engineer at MathWorks. She has a B.S. and M.S. in chemical engineering. At MathWorks, she primarily supports the pharmaceutical and biotechnology industry, and the computational biology sector.
Recorded: 19 Jan 2012
Featured Product
Statistics and Machine Learning Toolbox
Up Next:
Related Videos:
Select a Web Site
Choose a web site to get translated content where available and see local events and offers. Based on your location, we recommend that you select: .
You can also select a web site from the following list
How to Get Best Site Performance
Select the China site (in Chinese or English) for best site performance. Other MathWorks country sites are not optimized for visits from your location.
Americas
- América Latina (Español)
- Canada (English)
- United States (English)
Europe
- Belgium (English)
- Denmark (English)
- Deutschland (Deutsch)
- España (Español)
- Finland (English)
- France (Français)
- Ireland (English)
- Italia (Italiano)
- Luxembourg (English)
- Netherlands (English)
- Norway (English)
- Österreich (Deutsch)
- Portugal (English)
- Sweden (English)
- Switzerland
- United Kingdom (English)
Asia Pacific
- Australia (English)
- India (English)
- New Zealand (English)
- 中国
- 日本Japanese (日本語)
- 한국Korean (한국어)