Scalable Validation of Time-Series Data from Drilling Operations in AI-Based Decision Systems | MathWorks Energy Conference 2022
From the series: MathWorks Energy Conference 2022
Gustavo Sanchez, Pandatatech
Data validation is a paramount aspect of building reliable digital processes. Validation tells us whether a specific data channel is relevant, reliable, accurate, and valid for a specific decision. Using Statistics and Machine Learning Toolbox™ and Deep Learning Toolbox™ in MATLAB® and Docker container capabilities, learn how to deploy validation models for automated validation of time-series data.
Published: 22 Mar 2023
Hello, everyone. My name is Gustavo Sanchez. And I am co-founder and technical lead at Pandata Tech. And I want to thank the MathWorks companies to allow us to participate in the 2022 energy conference in Houston, Texas. Looking forward to learn from other panelists, speakers, and the MathWorks teams on everything that's recent about the product.
Real quick, our purpose as a company is to provide users algorithms and decision systems data they can trust. That is data that you can trust. We define trustworthy and reliable data by data that should be fully validated and fully labeled.
There are cybersecurity considerations to this problem. When we talk about data-driven decision systems such as IoT, when they are online, they have two types of vulnerabilities. A decision system needs to account for every type of vulnerability. External risks, which are the more understandable, the ones that we know of the most, are those that come from outside of the system. Think of hackers, bad actors trying to break into the system and inject some malware.
More importantly, one of these decision systems needs to account for internal risks. These are those that are inside the decision system whether they're people, components, configurations, well intentioned engineers making mistakes. All of these directly and adversely affect the quality of the data that then feeds the decision system. The decision system will then make bad, unreliable, risky decisions. The number one risk to data-driven online deployed decision systems is the data they depend on to be reliable. It is internal in nature.
From our industry, we know that in offshore drilling, a rig can be collecting over 40,000 different data channels. This is where the decision system starts, in the data collection. We know that data professionals can spend up to 80% of their time cleaning, validating, and labeling the data, validating and labeling being the bigger part of the statistic. We'll make that distinction later.
Algorithms for domain decisions-- these are maintenance, optimization, and automation algorithms, which is where usually the decision system ends-- need to have access to fully validated and labeled data. If they do not, they can miss upwards of 50% of predictable events, not to mention the amount of false positives in their predictions.
From our work, our customers, and our experience, we know that it can cost the company up to $75 a year to validate and label an individual data channel. So if a drilling company wanted to appropriately use every collected data channel, it would cost them $3 million a year validating and labeling on that individual rig. You can multiply that by 10 if you have 10 rigs, by 60 if you have 60 rigs.
Now this is an example of an industrial IoT decision system where sensors are at the machines and processes. And data travels through multilevel architectures or before it reaches the enterprise. The enterprise alone itself is very complicated and has multiple data transfer nodes and instances. Risk can be introduced in every step of this decision system, whether it is legacy or miscalibrated sensors creating bad data. Semantic mismatches at the field label, misconfigurations at the controls, comms, telemetry issues, or malicious intent-- it will directly and adversely affect the output of the decision system.
We've all experienced cables collecting mismatched signals. We've all experienced noise that shouldn't be there. We've all experienced configurations hidden somewhere in the pipeline that completely mess up our data. We all have stories. We can all share them. We can mitigate these risks by starting with the appropriate data quality and validation. And I'll make the distinction between cleaning, validating, and labeling here. So we'll talk about validation.
And data validation and data quality is not about removing missing values. It is not about finding outliers or simple anomaly detection. That's cleaning. That's easy. Anybody can do that. That takes no time and no money. However, to fully validate a data set, we need to make sure that each data channel is accurate, reliable, valid, and relevant for a specific decision in a specific point in time in a specific system. It gets complicated.
Furthermore, validated data needs to have context, to be labeled. To properly be labeled, data first needs to account for dynamic states so we need to map these states. For example, a hookload could be mapped into tripping and not tripping. You can map even further steps and slips. Data in one state does not look the same or behave the same as it does in other states. When you're tripping, we look one way. When you're in flips, it looks a different way. So high quality data across dynamic states is dynamic. When we're running a BOP, it looks different. When we're tripping, it looks different.
Once we label all these different dynamic states, we can now map the different events. These events can be for automation, optimization, or even previous maintenance events. There are specific events that happen in specific states. When we're mapping connections in a hookload, for example, that only happens when we're tripping and sometimes drilling, not when we're at slips. A basic connection mapping algorithm that does not account for state mapping will find a lot of connections when you're doing slips.
It is our jobs as data scientists to find patterns and automate decisions in ways that are explainable. We find the pattern and we automate the decision dynamically. It is not our job to just throw raw data at artificial intelligence and hope for the best. The neural network will find the pattern. That is incorrect. That's how we make mistakes and add risk. Validated and labeled data is our job.
Let's talk the validation technology first. Then obviously, this is all built using Matlab source code. It's all protected by endpoint protection. And step number one, it's about verification, making sure the appropriate metadata is defined for all individual data channels. Step number two is what we call intrinsic validation where we measure over 30 different validation checks on each individual data point, the time indices, and a sample of the signal.
Step 3 is our secret sauce, Google algorithm, Coca-Cola formula, whatever you want to call it, where we use physics, analytical methods, and even communication methods to create specifications of the behavior of each individual signal. A hookload behaves a certain way. A subsea pressure behaves a certain way. We do this for every single available channel on the application. And artificial intelligence makes sure that all the incoming data adheres to the state.
Now it's not to the specification. Now it's not just one specification per channel because we need to account for dynamic states and different operations. So it's hundreds and thousands of specifications. Those are the models that are trained for the artificial intelligence. Using Matlab, we've been able to do that scalably and repeatedly using the available tools and applications.
The final step is the quality score, sometimes referred to as the risk score, where we assign a value between 0 and 100 to each individual data channel. That quality definition is defined per the application. And 100% means there is no risk in using the data. And 0% means there's all the risk in using the data. Don't use the data.
Once we have validated, then we go into our second piece of technology, which is the validated data fed into the state mapping service. It's further processed whether physical, analytical, using comms theory into an AI-driven state mapping module. Now labeled data needs to be as close to 100% as possible. It needs to be reliable. So humans in the loop come in and validate the AI state mapping using a GUI, saving a lot of time.
The state labeled data is then separated by state. And we can map the individual events that happened at the different set, whether it's connections, whether it's cut and slips, whatever it is at individual states. Now again, it needs to be as close to 100%. A lot of these automated state and labeling technologies that transition from state or event to nonevent is where the technology can get murky and create a lot of mistakes in the deploying algorithms. So human-in-the-loop comes in, label gets us as close to 100% as humanly possible. And now we have a validated label data set ready to go.
To fully mitigate the risk, we need to be able to deploy where pragmatically possible. If we just validate in the enterprise, then we cannot identify where the risk was introduced. By validating throughout the decision system, the multilevel architectures, we can pinpoint where the risk was introduced.
For example, if we pass validation and supervisory controls but fail in the command and control center, well, the risk was introduced into the command and control center. Similarly, if we pass validation throughout the whole edge architecture but fail in the enterprise or the output of the decision model fails the validation, we may know it's time to retrain the algorithm that is domain.
The monetary value of resilient and deployed decision systems is immediate. Here you have the innovation director of the world's largest offshore drilling contract. They're saying that they were able to deploy what they thought would take two years in just 12 weeks because they mitigated intrinsic risk using the data quality method software.
What took a team of subject matter experts to do in one week, we were able to do in six minutes in a local computer. That is one individual channel remember out of 40,000, over 90 days, four and 1/2 million data points. Multiply that by 40,000. You don't have that many weeks to be able to validate. It's exponential. And it's automated. And it's more reliable than human-driven validation.
So let's go. Before we talk about how we deploy, how we use different MathWorks tools to protect the IP and deploy it in different people's stacks, let's talk about the hookload use case. What we call domain models are those that most people in the conference or watching, these are the models that you build. These are maintenance optimization and automation models for specific oil and gas or energy processes. These models create results.
Now the inputs of that model is sensor data, IADC, or state codes, and unstructured data. And again, we need to be able to validate that because we've seen bad sensors, bad channels, bad telemetry, humans make mistakes in the collection of unstructured and IADC code data, so on and so forth.
So what we need to do is we need to be able to create the most amount of insight from the least amount of data. What do I mean by that? If I don't have a hookload curve, I don't have a job. But I should be able to generate the most amount of insight from only the hookload curve. If I have a model with more different channels, I have more dependencies that need to be validated. So that's what this short demonstration is going to be about.
Let me set the stage. We are training a domain model for hookload, and we're using this beautiful looking hookload from location A. Now if we take a look, we have a full trip. We have a pretty good looking, not a lot of noise. It's a great looking hookload.
Now I train a model domain with an automation, optimization, or maintenance with this hookload. And then I try to deploy it in a separate rig yet the hookload collected in that rig looks like this. That model is not going to work. I just introduced risk by moving the same model into a different rig.
So what is the pragmatic validation? The physical specification AI model says this is only 40% of what this model expects as far as hookload. This is not the same data collection. This is not the same. There's risk somewhere in the pipeline of that multilevel collection architecture. And again, this problem can happen across workstations, rigs, locations, different workloads from workstations that are different that don't pass these validation checks will create risky and unreliable decision systems.
Now I don't want you to think this is all that data validation is. This is one very simple example. It's a little more tangible. We can use intrinsic validation on real time monitoring of the decision system to make sure that we're not making decisions with dropped or missing data that is handled differently with different configurations in different architectures. So we can do that as well.
Once we have the fully validated data, then we can go ahead and process it whether, again, it's physical, comms, or analytical theories, and start labeling the states. So here we have a hookload that's labeled for tripping states.
Now again, you'll see the human-in-the-loop value because while we can do this individually from the hookload in very small-- I believe this is at one hour chunks-- there are some transition problems. So look right before October 18. There's a little orange going up the initial part of the trip. That transition a human validate and creates a close to 100% perfectly state labeled hookload.
Once we label the hookload, we can label events at each of these different dynamic states as seen here. We're mapping for connections. And we only do that when tripping and drilling that we're avoiding any mistake of any connection that's detected in states that don't make sense. We're doing this automatically. We're doing this in a fraction of time. And it's wonderful. All of a sudden, we have a very simple, validated, beautifully labeled data set for connection mapping.
Now the question becomes, how do you do this at scale? We're talking specifically about a specific curve, a specific event. How do we deploy? We're talking about Matlab code. How do you integrate this Matlab code with everyone else's technology stacks? Everybody has applications supported by their own technology stacks. As a technology company that provides services and technology, we try not to do that. Instead, we try to create an application that can fit and be supported by open standard stacks.
Anyway, the answer to these questions of deployment and scalability is by having flexible edge architectures and scalable cloud architectures with software workers available. This is our reference architecture for deploying instances of our technology using Matlab Production Server in the cloud. And this particular architecture works with local applications on the edge but also instances calling centralized applications on the cloud. There are other fully edge noncloud deployment options, including with Matlab integration.
This includes Docker containers which, as of 2021, it compiles and puts in the container only the necessary amount of Matlab, not all of Matlab but just the necessary amount of the language and program to be able to use that container. It's game-changing because it reduces the footprint. But there's other options in using software SDKs and compilers to be able to integrate with open source, maybe make some C code using Decoder.
For the rest of the presentation, we're going to focus on the production server. What you see is the cloud resource group where virtual machines house both production servers and software workers. Now depending on how many software workers you have, you may want to use two virtual machines. The compiled Matlab program is also one of the VMs. You're seeing full network and endpoint securities on deployments as well as options for the edge and the centralized UI calling of the application.
Inside the Azure instance, there are application services, network security, VMs, one or two, depending again on the amount of workers. You have databases, caches, storage, and virtual networks. You will notice by looking at the top corner that this is Microsoft Azure government instance. And there's a reason I'm showing you this because I want to talk about a specific application that Matlab and MathWorks have to create resource groups.
In commercially available cloud, like non-government Azure and AWS, there's an app that automatically creates this for you in a handful of minutes. It's incredible. However that app is not available, at least when we spin this up, on the government side, but it was very straightforward and easy to set up the resource group. It's not a complicated architecture. It's not a complicated need. And whether the app or manually, it can be done incredibly quick. I believe the first time we span this up, it took an hour or two to figure it out.
Here's an instance of the production server with four software workers available, meaning we can have four concurrent calls to the application with no queue. CPU and memory utilization fully depends on the VM and/or hardware where you're deploying. Right now we're doing one individual call. Two, again, you'll see right there at the URL to the production server housed in the government cloud.
That particular cloud is local so I'm using a local instance of my application UI, whatever you want to call it, or whatever is calling the application. And it reaches through the network and endpoint security, the application, without a hitch. So notice right there with the arrow. Local host, IP network, for that example.
Now because this is a deployment of four workers, now we have another concurrent call with no queue in the line. The second call is from an application instance that is stored in the cloud. Notice the URL, pandatatechdemo.azurewebsite.us So what we're showing here is that the production server can be called from virtually anywhere-- well, virtually and physically anywhere.
We can even integrate this architecture into other big platforms. Here we have an example of the Siemens MindSphere. The reference architecture that we just described and showed is being called by MindSphere in two separate instances. So notice we have the two logos right there, one called Pandata Tech, one called Squiggly.
We are in the developer cockpit of MindSphere. And we're calling the architecture. So I'll play a little video showing you what we're doing here. So we have the tool and we'll go ahead and open them.
The first one is a geothermal facility closed loop that we're mitigating the internal risk of the channels. We're using a stoplight system to monitor because this was intended for use for 18-year-old military personnel. And they preferred to use a stoplight system for visualization.
This geothermal facility provides utilities and energy to military bases. So notice there's risk in the pumps. We can figure out maybe why there's a really low quality score or we can go dig in a little bit more.
If we look at that pump speed all the way at the top, you'll see that there's a normal value of 0. That's one of the intrinsic validation checks that means, hey, this is not normal. And prediction, zero, meaning it's not passing those physical behavioral checks from the specifications.
We can trend these signals, again using the same stoplight system as required by the user, where you'll see September 4 all the way to 7 with zero prediction event value. We can even download the work and the validated data down to the level. So engineers can bring them in into their own environments and essentially do whatever they want with the data.
Here's an MLX integration using MindSphere in Matlab Production Server. We have a facility temperature that's a facility that uses this geothermal energy generated. And you'll see about January 10 all the bad data. Quote unquote "bad data." Because we know the state mapping of the system, we can ignore that and move on. That's actually good data.
On January 19, we have a very high quality score. Notice the temperature signal. Very smooth. We may have some missing values but that's OK. In January 28, we have a really bad quality score. That dip in that signal correct prediction means it failed the validation physical behavioral checks.
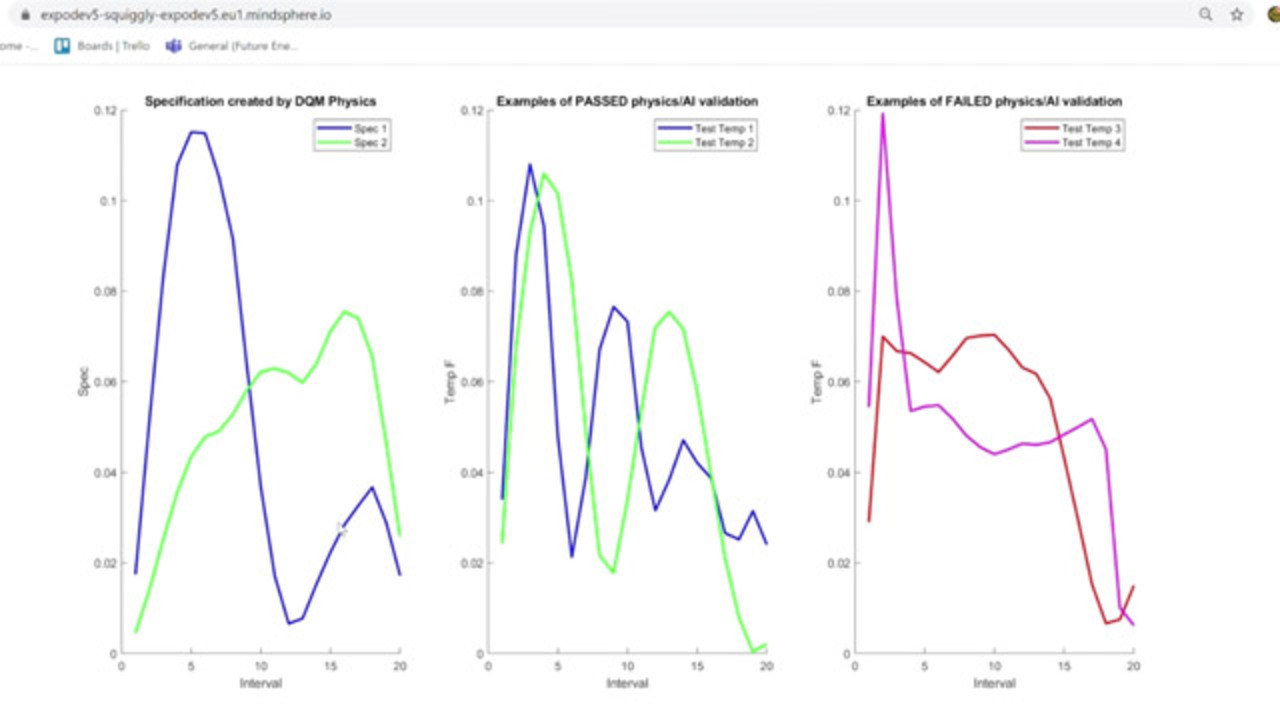
Let's see what happened. We have in a matter of 15 minutes an ambient temperature, just like the one you're in, that goes from under 46 Fahrenheit, swings to 58, and back to the mean. That's just physically impossible. So how do we do this physical specification? We will go from the time domain to the interval domain where we create these physical specifications for that one temperature, meaning we create a multivariate system. The third plot here shows failed specifications like the one we just saw at the top.
Again, we're calling Matlab Production Server with our technology housed inside from MindSphere, which is a Siemen stack. We're calling it from local environments and we're also calling it from the same cloud environment. It's a very scalable architecture that has allowed us not only to protect their technology and source code but also provide services in any variety of ways.
Thank you very much. Looking forward to speaking with everyone else.


Select a Web Site
Choose a web site to get translated content where available and see local events and offers. Based on your location, we recommend that you select: United States.
You can also select a web site from the following list
Americas
- América Latina (Español)
- Canada (English)
- United States (English)
Europe
- Belgium (English)
- Denmark (English)
- Deutschland (Deutsch)
- España (Español)
- Finland (English)
- France (Français)
- Ireland (English)
- Italia (Italiano)
- Luxembourg (English)
- Netherlands (English)
- Norway (English)
- Österreich (Deutsch)
- Portugal (English)
- Sweden (English)
- Switzerland
- United Kingdom (English)