How to read numeric data with different number of columns
Is this what you are looking for? file = "data.txt"; t = readtable(file, 'ReadRowNames',true,"Delimiter",'\t') The data file...
1 year ago | 0
| accepted
Understand values differences between smooth and smoothdata functions
> Is there a difference in window calculation between smooth and smoothdata for 'lowess' method These two functions compute the...
1 year ago | 1
Unable to see uifigure object properties
Let's see if I understand your workflow. Please correct me if this summary is incorrect. rbBar and rbLine are defined in a fun...
1 year ago | 0
Remove NaNs from uitable Matlab App
Can a UITable show missing values or NaNs as empty? Currently there is not an option to show missing or NaN values as empty in ...
1 year ago | 2
| accepted
Discussion
MATLAB Community gets shout-out in pod cast
Three former MathWorks employees, Steve Wilcockson, David Bergstein, and Gareth Thomas, joined the ArrayCast pod cast to discuss...
1 year ago | 11
Published
Violin Plot: A Tool For Visualizing Distributions
Guest Writer: Baldvin Einarsson Baldvin is a software engineer in the Statistics and Machine Learning Toolbox. His...
1 year ago

how to add geoplot scatter plot custom icon overlays?
If you're using MATLAB R2024b or later and have the Mapping Toolbox, use the new geoiconchart. lat = [37.7749, 34.0522, 40.7128...
1 year ago | 2
How to rotate rectangular with a an angle?
MATLAB's polyshape has a rotate function that makes this fairly easy. Instead of the [left, bottom, width, height] input used i...
1 year ago | 1
Superscripts and subscripts in fprintf
Not all letters have unicode subscripts but m, a, and x do, so you're in luck. x = 2; fprintf(1,'Maximum value of N is N%c%c%...
1 year ago | 0
how to halt a for loop in an external function called from mlapp by using a stop button in the mlap app
> Do I need to pass in app.stopFlag as an argument with the function when I call it, I thought that making app.stopFlag public w...
1 year ago | 0
Discussion
bubblechart + bar plot - graphics
Check out this 3D chart that won Visual Of The Year for 2024 by Visual Capitalist. It's a mashup between a 3D bubblechart and a...
1 year ago | 3
Zoom of image on UIAxes seems to have one axis bound
Try setting the DataAspectRatio to [1 1 1] using axis(uiax,'equal'). If that doesn't fix the issue, it would help to share a ...
1 year ago | 0
| accepted
How to disable or delete cameratoolbar context menu
This stumped me for a bit but I've found a potential workaround. I'll also make a note of this issue for discussion. Workaroun...
1 year ago | 0
Why is bootci giving different interval than prctile?
You're using two different alpha values. When you call bootci, you specify alpha as 0.05 or 5%. When you call prctile, you'...
1 year ago | 1
| accepted
What are All of the Variables in the Workspace on Answers?
Fixed! Thanks for reporting it. myvar = 5; whos
1 year ago | 2
| accepted
Published
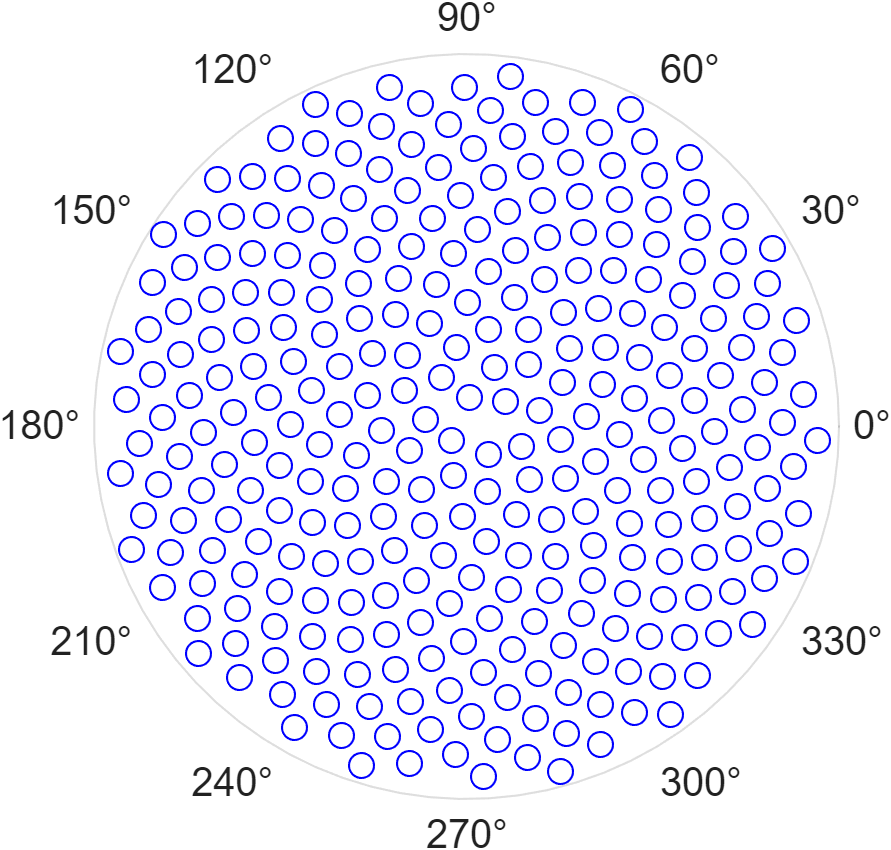
Pinecode: Creating pinecones with Fibonacci spirals
Today we explore phyllotactic spirals, a naturally emerging pattern found in densely packed plant structures such as...
1 year ago
Copy/Paste from ListBox at runtime
Add a right-click "copy" option to ListBox Create a context menu for the list box and set its MenuSelectedFcn to use clipboard...
1 year ago | 1
| accepted
Published
Share your Apps with MATLAB Online and Focused View: A Pumpkin Example
Guest Writer: Eric Ludlam Today Eric Ludlam shares three steps to share your app with others using a hyperlink. Eric is...
1 year ago

Automatic line selection bug
Ensure that your mouse button isn't stuck. I haven't seen this issue but if it continues to occur after closing and reopening M...
1 year ago | 0
Cannot Open any MLAPP with axes
This appears to be the same issue as in the thread Saurabh mentioned. If you want to try to fix this yourself I suggest you cre...
1 year ago | 1
Where can I get a matlab coffee cup?
Check out the new MathWorks Merch Shop: https://mathworksmerch.com/ Announcement: https://blogs.mathworks.com/community/2024/11...
1 year ago | 4
when I move the plot, the text is not displayed outside the plot itself
When you create the text labels, set clipping to on. text(___,'Clipping','on')
1 year ago | 0
| accepted
Is there any way to add a set of random punctual z values labels inside the plot using a contourf x, y, z command?
Add a set of random z value labels inside a contourf plot This demo shows the following. Define x (vector), y (vector), and z...
1 year ago | 0
| accepted
Serial: Real-time plotting and storaging streaming data from Arduino slowing down badly over time
Calling plot(__) with hold on in a loop is inefficient. Every time new points are added to the axes, new line objects are creat...
1 year ago | 0
Discussion
Find unsuppressed outputs in R2024b using dbstop
It's frustrating when a long function or script runs and prints unexpected outputs to the command window. The line producing th...
1 year ago | 7
Published
Narrow down your legends with IconColumnWidth
Guest Writer: Afiq Azaibi Afiq Azaibi is back to tell us about a new feature in R2024b that controls the width of a...
1 year ago

Violin plot has tails that go beyond real data
The important concept to understand is that violin plots show a visual estimate of the data’s distribution beyond the observed v...
1 year ago | 0
How to creat grouped violin plot?
MATLAB R2024b introduces a new violinplot with a grouping option. data = random(makedist('Weibull'),1000,8); xgroup = catego...
1 year ago | 0
how to do violin plot in matlab
MATLAB now has a violinplot, introduced in R2024b. See also swarmchart tiledlayout(3,1) violinplot(nexttile,rand(20,3).*[.8 ...
1 year ago | 0
How to create an external plot in live editor?
f = figure(); plot(magic(5)) f.Visible = 'on'; % This sets the external figure visibility to on alternatively, use uifigure...
1 year ago | 0