Find Statistics of Circular Blobs in Image
This example shows how to find the centroid, perimeter, and bounding box coordinates of circular blobs in an image by using the Blob Analysis block. The model also outputs the label matrix for reference.
Load Data To MATLAB Workspace
Read an image into the MATLAB® workspace.
I = imread('coins.png');
Load a binary mask containing the blobs that represent the segmented objects in the input image.
load('maskImage','BW');
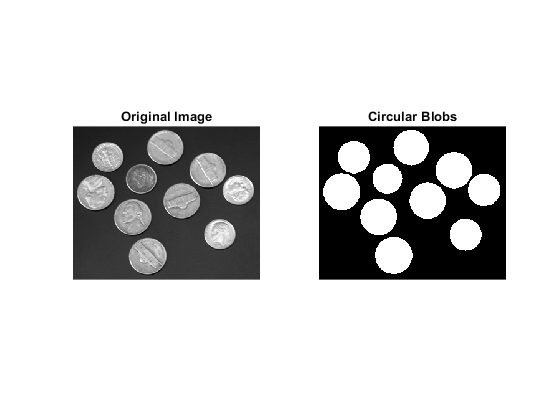
Display the input image and the corresponding binary mask. The binary mask consists of 10 circular blobs of varied statistics.
figure
subplot(1,2,1)
imshow(I,[]);
title('Original Image');
subplot(1,2,2)
imshow(BW)
title('Circular Blobs');
Example Model
Open the simulink model.
open_system('ex_blkblobanalysis.slx')
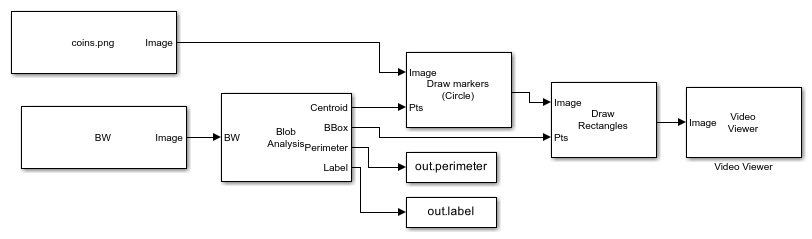
The model computes the centroid, perimeter, and bounding box coordinates for the blobs in the binary image. The computed statistics is overlaid on the input image by using the Draw Markers and Draw Rectangles blocks.
The number of output blobs parameter of Blob Analysis block is set equal to the number of blobs in the binary mask. The Draw Markers block plots the computed centroids and the Draw Rectangles block draws the bounding boxes. The perimeter values are exported as variable perimeter to the MATLAB workspace. The label matrix is exported as variable label to the MATLAB workspace.
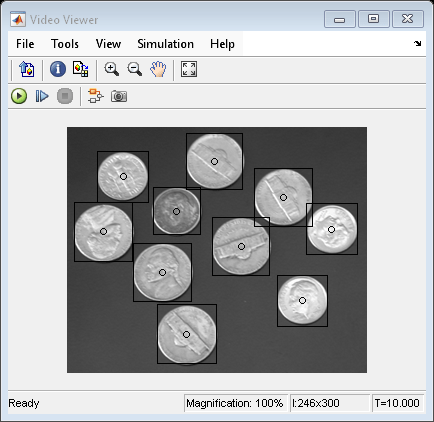
Simulate and Display Results
Run the model and display the results using the Video Viewer block. The computed centroid and the bounding box are overlaid on the original image. The circular markers specifies the centroid of each blob and the rectangles around each blob specifies the computed bounding boxes.
out = sim('ex_blkblobanalysis.slx');
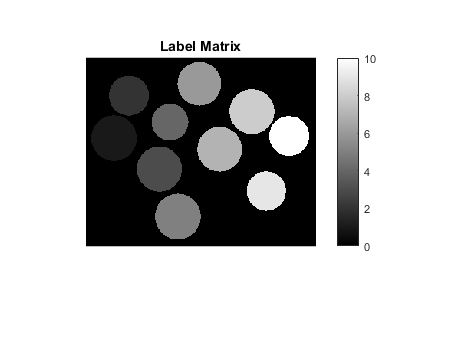
The first value in all the computed statistics correspond to the blob with label value 1. Similarly, the second values correspond to the blob with label value 2 and so on. The label value 0 corresponding to the background of the mask must be ignored.
Read the unique label values from the label matrix.
lb = unique(out.label);
Display the perimeter values and the corresponding label values as a table.
table(lb(2:end),out.perimeter,'VariableNames',{'Label','Perimeter'})
ans =

  10×2 table

    Label    Perimeter
    _____    _________

      1       194.17
      2       170.02
      3       191.58
      4       156.37
      5       195.58
      6       186.51
      7       190.75
      8       192.17
      9       167.44
     10       168.85
Display the label matrix.
figure
imshow(out.label,[]);
colorbar
title('Label Matrix');