Flight Instrument Gauge Visualization for Drone
R2026bImport and visualize a drone flight log using 3-D animations and flight instrument gauges. Obtain a high-level overview of flight performance in MATLAB® using Flight Instruments (Aerospace Toolbox) functions from Aerospace Toolbox™. Then, view signals in a custom interface in Simulink® using the Flight Instruments (Aerospace Blockset) blocks from Aerospace Blockset™.
Extract the signals of interest from a ULOG file and play back the unmanned aerial vehicle (UAV) flight trajectory in MATLAB. Then, replay those signals in a Simulink model using instrument blocks.
Import a Flight Log
A drone log file records information about the flight at regular time intervals. Use this information to analyze flight performance. Flight instrument gauges display navigation variables such as attitude, altitude, and heading of the drone. The ULOG file for this example comes from an airplane model running in the Gazebo simulator.
Import the log file using ulogreader. Create a flightLogSignalMapping object for ULOG files.
To understand the signal conventions, units, and reference frames, inspect the information in the plotter object. This unit information is essential when connecting signals to flight instrument gauges.
data = ulogreader("flight.ulg");
plotter = flightLogSignalMapping("ulog");
info(plotter,"Signal")
ans = 18×4 table
                  "Accel"    1                                                                                                                                                                                      "AccelX, AccelY, AccelZ"                                  "m/s^2, m/s^2, m/s^2"
               "Airspeed"    1                                                                                                                                                                   "PressDiff, IndicatedAirSpeed, Temperature"                                     "Pa, m/s, degreeC"
          "AttitudeEuler"    1                                                                                                                                                                                            "Roll, Pitch, Yaw"                                        "rad, rad, rad"
           "AttitudeRate"    1                                                                                                                                                     "BodyRotationRateX, BodyRotationRateY, BodyRotationRateZ"                                  "rad/s, rad/s, rad/s"
    "AttitudeTargetEuler"    1                                                                                                                                                                          "RollTarget, PitchTarget, YawTarget"                                        "rad, rad, rad"
              "Barometer"    1                                                                                                                                                                        "PressAbs, PressAltitude, Temperature"                                       "Pa, m, degreeC"
                "Battery"    1    "Voltage_1, Voltage_2, Voltage_3, Voltage_4, Voltage_5, Voltage_6, Voltage_7, Voltage_8, Voltage_9, Voltage_10, Voltage_11, Voltage_12, Voltage_13, Voltage_14, Voltage_15, Voltage_16, RemainingCapacity"    "v, v, v, v, v, v, v, v, v, v, v, v, v, v, v, v, %"
                    "GPS"    1                                                                                                                                  "Latitude, Longitude, Altitude, GroundSpeed, CourseAngle, SatellitesVisible"                  "degree, degree, m, m/s, degree, N/A"
                   "Gyro"    1                                                                                                                                                                                         "GyroX, GyroY, GyroZ"                                  "rad/s, rad/s, rad/s"
               "LocalENU"    1                                                                                                                                                                                                     "X, Y, Z"                                              "m, m, m"
         "LocalENUTarget"    1                                                                                                                                                                                   "XTarget, YTarget, ZTarget"                                              "m, m, m"
            "LocalENUVel"    1                                                                                                                                                                                                  "VX, VY, VZ"                                        "m/s, m/s, m/s"
      "LocalENUVelTarget"    1                                                                                                                                                                                "VXTarget, VYTarget, VZTarget"                                        "m/s, m/s, m/s"
               "LocalNED"    1                                                                                                                                                                                                     "X, Y, Z"                                              "m, m, m"
      ⋮
Extract Signals of Interest
To visualize the drone flight using instrument gauges, extract the attitude, position, velocity, and airspeed at each time step. Specify the appropriate signal name from the info table in the previous step. Call the extract function with the appropriate signal names. Adjust the time vector elements so they start at 0 seconds.
% Extract attitude and roll-pitch-yaw data.
rpy = extract(plotter, data,"AttitudeEuler");
rpy{1}.Time=rpy{1}.Time-rpy{1}.Time(1);

RollData = timetable(rpy{1}.Time,rpy{1}.Roll,...
               'VariableNames',{'Roll'});
PitchData = timetable(rpy{1}.Time,rpy{1}.Pitch,...
               'VariableNames',{'Pitch'});
YawData = timetable(rpy{1}.Time,rpy{1}.Yaw,...
               'VariableNames',{'Yaw'});

% Extract position and xyz data.
Position = extract(plotter, data,"LocalNED");
Position{1}.Time = Position{1}.Time-Position{1}.Time(1);

X = timetable(Position{1}.Time,Position{1}.X,...
               'VariableNames',{'X'});
Y = timetable(Position{1}.Time,Position{1}.Y,...
               'VariableNames',{'Y'});
Z = timetable(Position{1}.Time,Position{1}.Z,...
                'VariableNames',{'Z'});

% Extract velocity data.
vel = extract(plotter, data,"LocalNEDVel");
vel{1}.Time=vel{1}.Time-vel{1}.Time(1);

XVel = timetable(vel{1}.Time,vel{1}.VX,...
               'VariableNames',{'VX'});
YVel = timetable(vel{1}.Time,vel{1}.VY,...
               'VariableNames',{'VY'});
ZVel = timetable(vel{1}.Time,vel{1}.VZ,...
               'VariableNames',{'VZ'});


% Extract Airspeed magnitude data.
airspeed = extract(plotter, data,"Airspeed");
Airspeed = timetable(airspeed{1}.Time,airspeed{1}.IndicatedAirSpeed,...
               'VariableNames',{'Airspeed'});
Convert Units and Preprocess Data for Gauges
The flight log records data in SI units. The flight instrument gauges require a conversion to the English unit system. The visualization block in the attached Simulink model handles this conversion. The turn coordinator indicates the yaw rate of the aircraft using an indicative banking motion (which differs from the bank angle). To compute the yaw rate, convert the angular rates from body frame to vehicle frame using the following equation:
The inclinometer ball in the turn coordinator indicates the sideslip of the aircraft. This sideslip angle depends on the angle between the aircraft body and the computed airspeed. An accurate airspeed requires a good estimate of velocity and wind vector. Most small UAVs lack sensors to estimate wind vector data or airspeed during flight. UAVs can encounter crosswinds of between 20% and 50% of their airspeed.
To compute sideslip and turn, extract wind and attitude rate data directly from the log file.
% Extract roll, pitch and yaw rates and an estimated windspeed.
[p,q,r,wn,we] = helperExtractUnmappedData(data);

% Merge timetables.
FlightData = synchronize(X,Y,Z,RollData,PitchData,YawData,XVel,YVel,ZVel,p,q,r,Airspeed,wn,we,'union','linear');

% Assemble an array for the data.
FlightDataArray = double([seconds(FlightData.Time) FlightData.X FlightData.Y FlightData.Z FlightData.Roll ...
FlightData.Pitch FlightData.Yaw,FlightData.VX,FlightData.VY,...
    FlightData.VZ,FlightData.p,FlightData.q,FlightData.r,FlightData.Airspeed,FlightData.wn,FlightData.we]);

% Ensure time rows are unique.
[~,ind]=unique(FlightDataArray(:,1));
FlightDataArray=FlightDataArray(ind,:);

% Preprocess time data to specific times.
flightdata = double(FlightDataArray(FlightDataArray(:,1)>=0,1:end));
Visualize Standard Flight Instrument Data in MATLAB
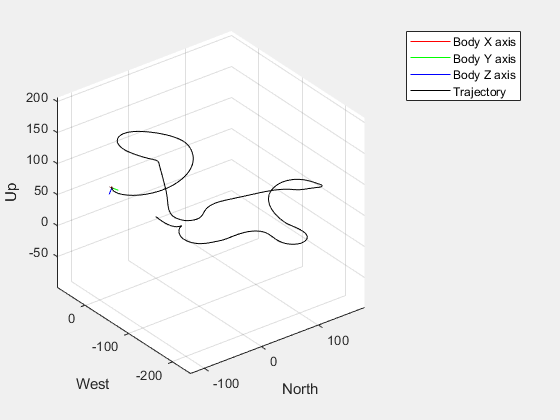
To get a quick overview of the flight, use the animation interface introduced in the Display Flight Trajectory Data Using Flight Instruments and Flight Animation (Aerospace Toolbox) example. The helper function helperDroneInstruments creates an instrument animation interface.
helperDroneInstruments;
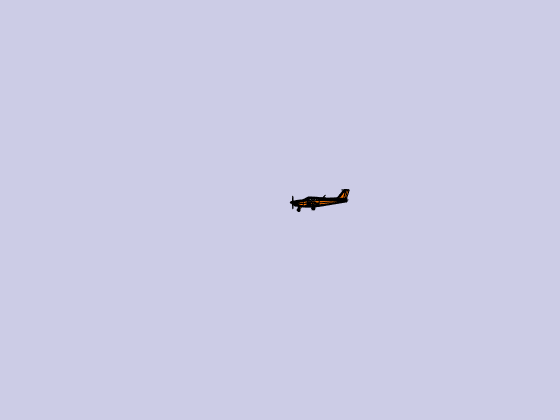
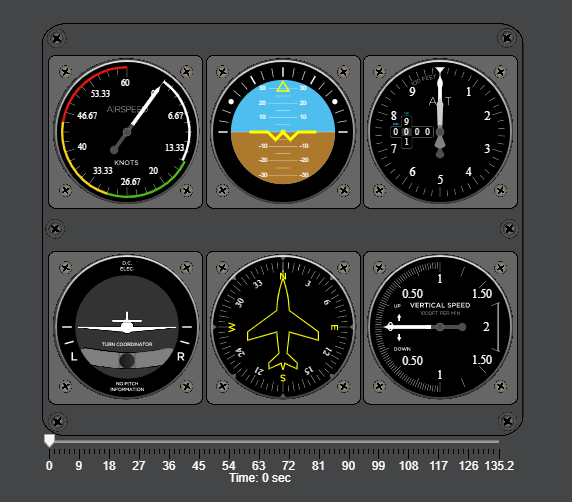
The Airspeed indicator dial indicates the speed of the drone. The Artificial Horizon indicator reveals the attitude of the drone excluding yaw. The Altimeter and Climb Rate indicators reveal the altitude as recorded in the barometer and the climb rate sensors, respectively. The Turn Coordinator indicates the yaw rate of the aircraft and sideslip. If the inclinometer skews toward the left or right, this denotes a slip or skid situation. In a coordinated turn, the sideslip is zero.
Visualize Signals in Simulink
To help diagnose problems with a flight, create custom signal visualizations in Simulink using instrument blocks. For example, voltage and battery data in log files can help diagnose failures due to inadequate power or voltage spikes. Extract battery data to visualize it.
% Extract battery data.
Battery = extract(plotter,data,"Battery");
% Extract voltage data from topic.
Voltage = timetable(Battery{1}.Time,Battery{1}.Voltage_1,...
               'VariableNames',{'Voltage_1'});
% Extract remaining battery capacity data from topic.
Capacity = timetable(Battery{1}.Time,Battery{1}.RemainingCapacity,...
               'VariableNames',{'RemainingCapacity'});
Open the 'dronegauges' model. This model takes the loaded data and displays it on the gauges and the UAV animation figure.
open_system('dronegauges');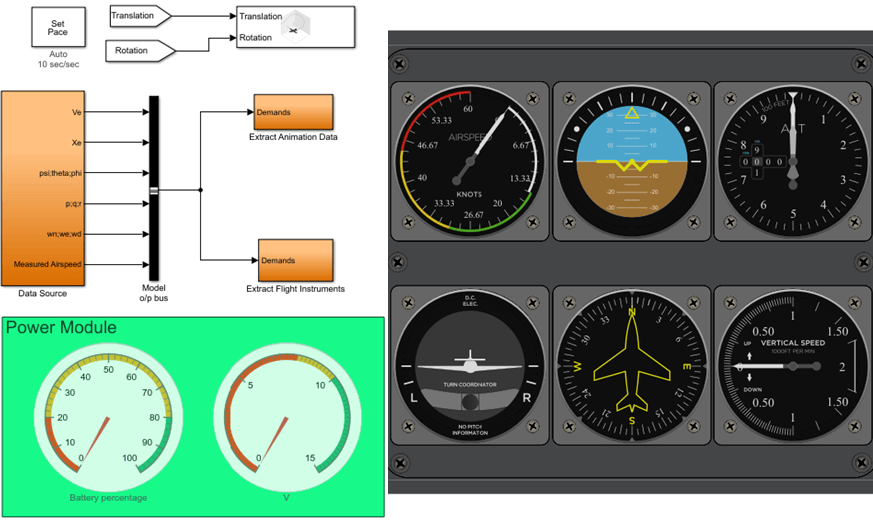
Run the model. The generated figure shows the trajectory of the UAV in real time, and the gauges show the current status of the flight.
sim('dronegauges');