Share Data with Simulink and the MATLAB Workspace
Stateflow® charts exchange data with Simulink® models through input and output ports. You can also initialize data values from the MATLAB® workspace and save final results back to the workspace.
Data Flow Between Stateflow and Simulink
Simulink signals can flow to your Stateflow chart, representing sensor readings, user inputs, or data from other blocks. In the other direction, data can flow from your Stateflow chart to Simulink as control signals, status information, or simulation results.
Create Input and Output Connections
Use input and output connections to specify how your Stateflow chart uses and directs data to and from Simulink.
Add Input Data
Input data brings information from Simulink into your chart.
Add a data object to your chart. See Add Stateflow Data.
Set the Scope property to
Input Data. An input port appears on the left side of the chart block.Connect a Simulink signal to the input port.
The chart receives the signal value and updates the data each time Simulink runs.
Add Output Data
Output data sends information from your chart to Simulink.
Add a data object to your chart.
Set the Scope property to
Output Data. An output port appears on the right side of the chart block.Connect the output port to other Simulink blocks.
Set an initial value for the output data. This value appears at the output port before your chart runs.
Your chart updates the output value by assigning to the data name in state actions or transition actions.
Port Numbering
Input and output ports appear in the order you create the data objects. To change the port order:
Select the data object in the Symbols pane.
In the Property Inspector, change the Port property to the desired port number.
When you change one port number, the other ports automatically renumber to avoid conflicts.
Connect Multiple Signals
For multiple inputs or outputs, create separate data objects for each connection.
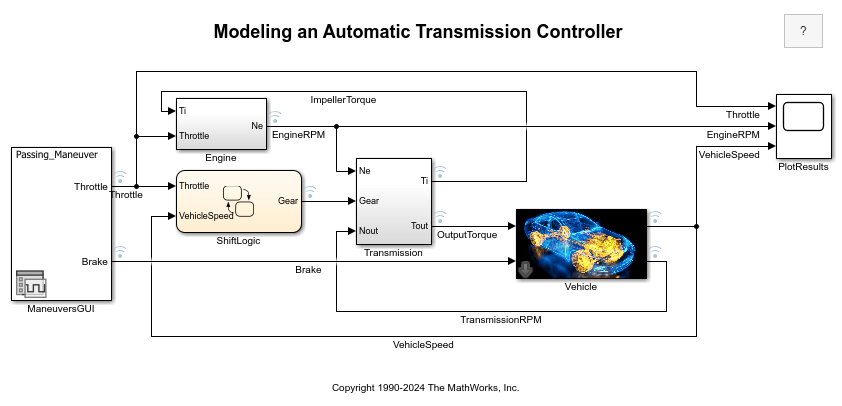
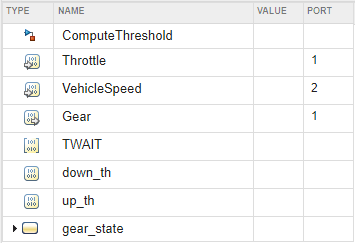
This Simulink model has two signals, Throttle and
VehicleSpeed that become inputs for Stateflow. In the Symbols pane, the two Simulink signals appear as input data.
Initialize Data from MATLAB Workspace
You can set the initial values of local and output data using variables from the MATLAB workspace.
Define and initialize a variable in the MATLAB workspace:
initial_speed = 2000; %RPM
In your Stateflow chart, create a data object with the same name as the MATLAB variable.
Set the Initialize method property to
Parameter.
When you start the simulation, the Stateflow data object gets its initial value from the MATLAB variable. You can set the initial values in MATLAB for local data and output data.
Data initialization occurs when simulation starts or when the chart reinitializes as part of an enabled subsystem.
Save Results to MATLAB Workspace
For charts that use C as the action language, you can save the final value of data objects to the MATLAB workspace.
Open the Model Explorer. In the Modeling tab, select Model Explorer.
In the Contents pane, select the data object.
In the Description pane of the Data properties dialog box, select Save final value to base workspace.
After simulation completes, a variable with the same name as the data object appears in the
MATLAB workspace that contains the final value. This option works for data objects of all
scopes except Constant and Parameter.
Working with Simulink Data Types
By default, Stateflow data inherits its type from connected Simulink signals. For input data, the chart automatically uses the type of the incoming signal. For output data, you can specify a type or let Simulink determine the appropriate type based on the connected blocks.
To specify data types explicitly, see Specify Scope and Type of Stateflow Data.