Graph Data Extractor
Description
Use the Graph Data Extractor app to import graphs from part datasheets, modify the point data as needed, and then export selected data as MATLAB® data files. You can later use these data files for block parameterization.
The Graph Data Extractor app enables you to:
Import graphs from part datasheet PDFs.
Calibrate the data axes.
Select applicable points on the data curves to form a table.
Modify the point data, if needed, either by moving the points or by editing the table.
Optionally plot multiple curves on a common grid along the X axis.
Export selected data as MATLAB data files.

Open the Graph Data Extractor
MATLAB Toolstrip: On the Apps tab, under Simscape, click the Graph Data Extractor icon.
MATLAB command prompt: Enter
graphDataExtractor.
Examples
Open a manufacturer datasheet PDF. Using the Microsoft® Snipping Tool or a similar app, capture the plot of interest and save it as an image file. The supported file formats are:
bmp,gif,jpg,jpeg,png,tif.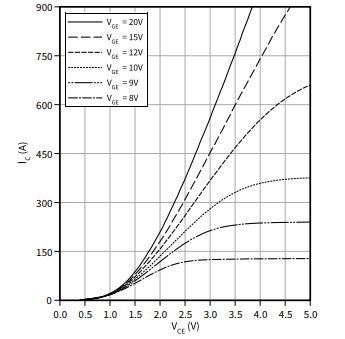
Open the Graph Data Extractor:
graphDataExtractor
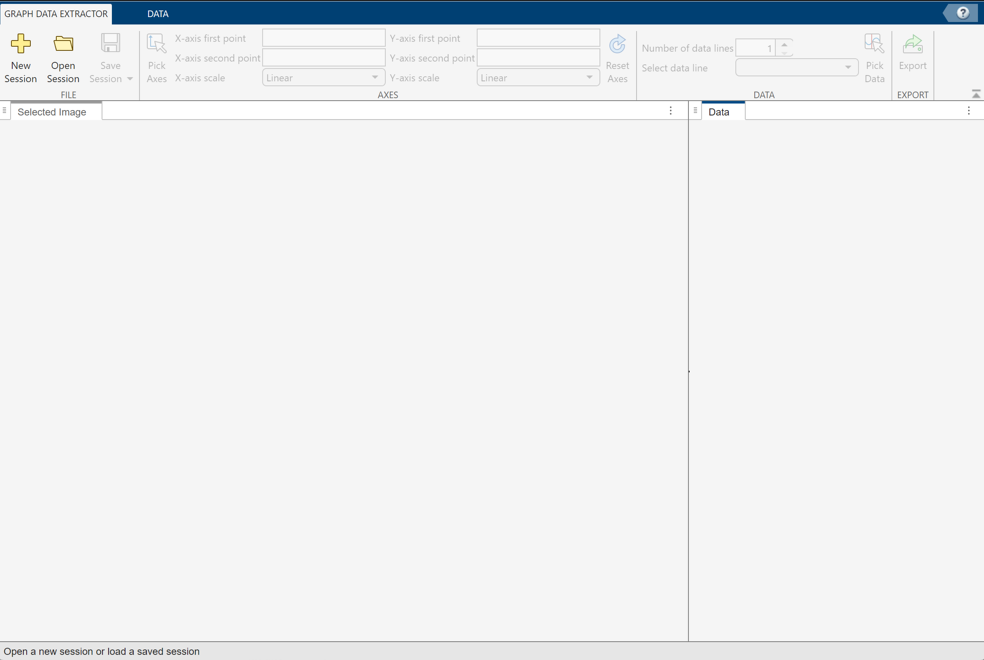
Click New Session and select the image file saved in Step 1.
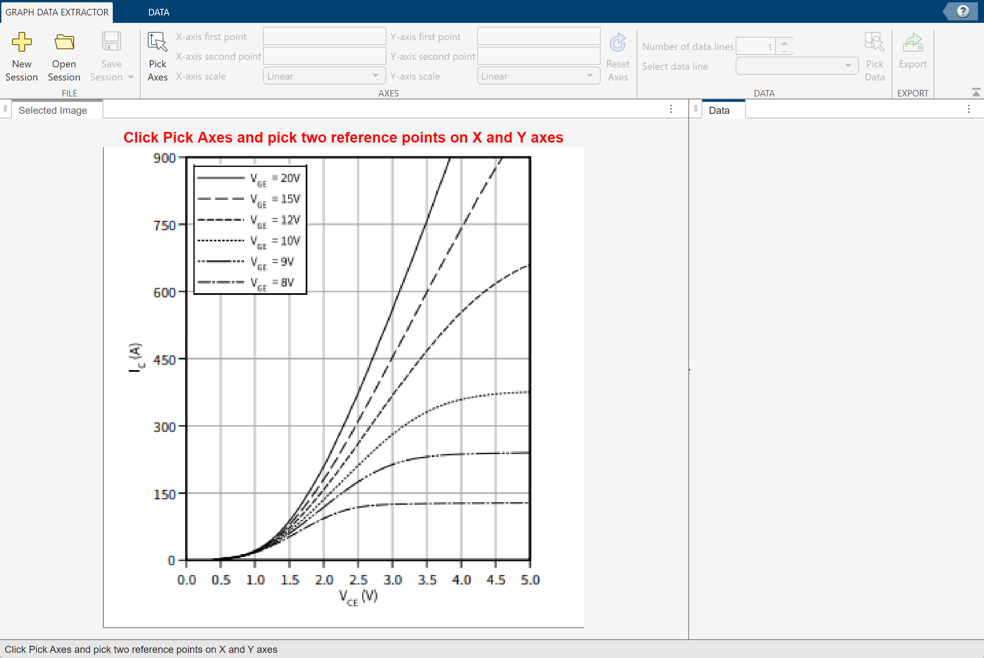
Follow the prompts in the Graph Data Extractor Window. First, specify the plot scale by picking the reference points on the X and Y axes and entering corresponding values in the toolstrip fields. You do not have to pick minimum and maximum points. Pick two reference points for each axis, and the app calibrates the plot based on the values you enter.
Select a point on the X axis. The app marks the point in blue.
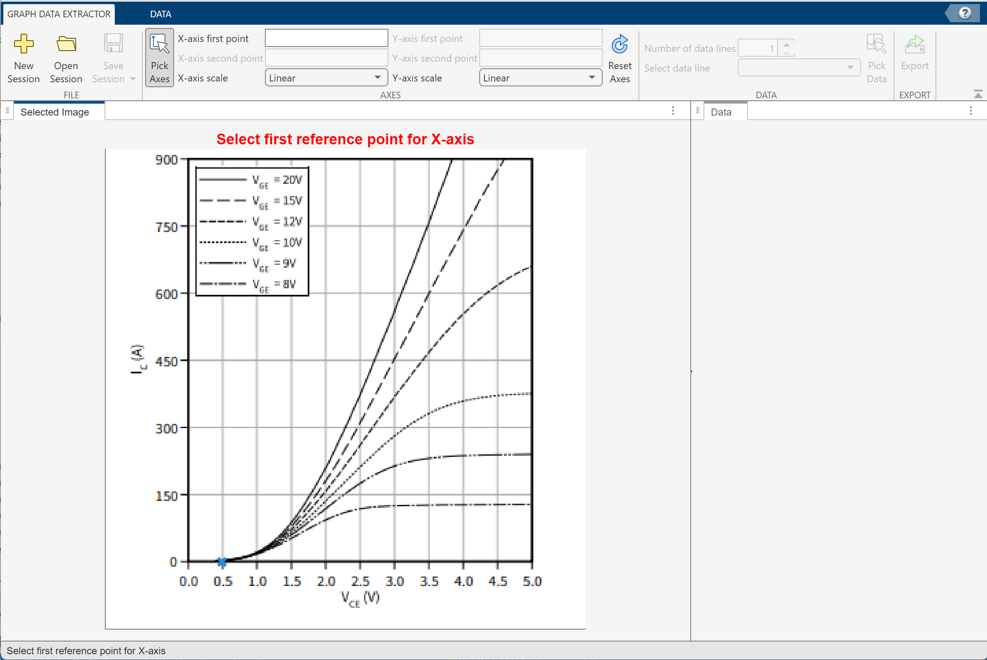
In the Graph Data Extractor toolstrip, in the X-Axis First Point field, enter
0.5.Repeat the process for the second reference point on the X axis. Then, select two reference points on the Y axis and also enter the values in the toolstrip fields.

In this example, you import points from one data line, so keep the Number of Data Lines value of
1.Toggle the Pick Data button on and select several points on the third line from the bottom, which corresponds to VCE = 10V.
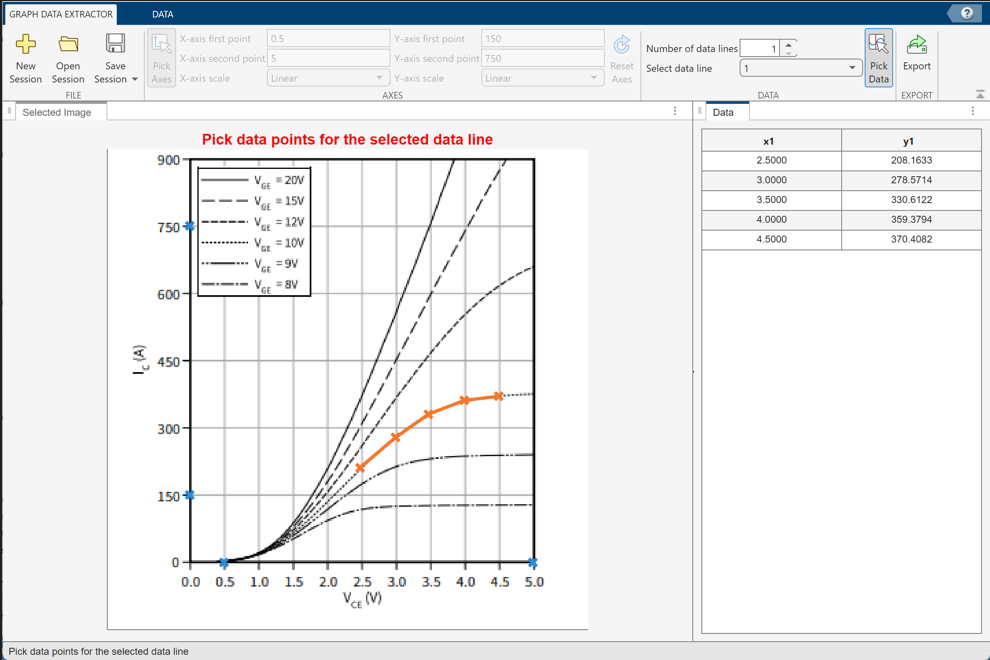
The app marks the selected points in orange and generates a table of the X and Y coordinates for each point.
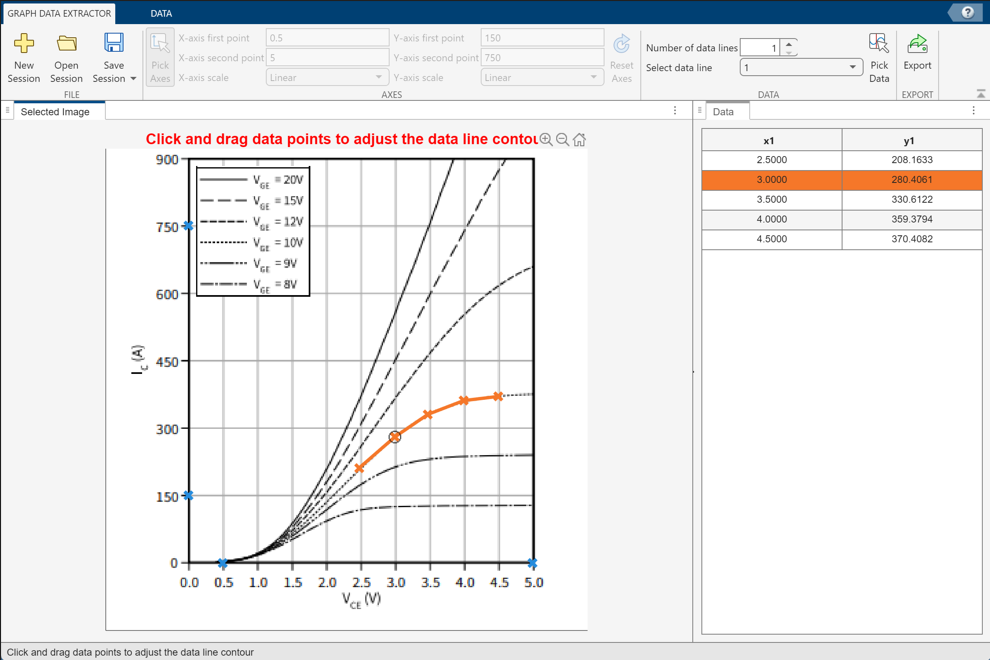
To adjust the point positions, toggle the Pick Data button off. Drag the second point along the line, to x1 = 3.0080. When you start dragging a point, the corresponding table cells are highlighted in orange. You can enter the desired coordinates directly in the table cells.
When satisfied with the point positions, click Export and specify the file name, for example,
IGBT_plot1. The app exports the table as a MAT file. You can later use this file for block parameterization.Click the Save Session button and save the current state of the Graph Data Extractor app as a MAT file. To distinguish it from the
IGBT_plot1.matfile, which contains just the exported table data, name the saved session fileIGBT_plot1_session1.mat. You can later load a saved session file into Graph Data Extractor and add or modify data points, as shown in the next example.
Open the Graph Data Extractor:
graphDataExtractor
Click Open Session and select the session file,
IGBT_plot1_session1.mat, saved in the previous example.
The table in the right pane of the Graph Data Extractor Window contains x1 and y1 coordinates of the five data points selected on the VCE = 10V plot line. You are now going to add points from a second line.
In the toolstrip, change the Number of Data Lines value to
2.In the Select Data Line drop-down, select
2.Toggle the Pick Data button on and select seven points on the fourth line from the bottom, which corresponds to VCE = 12V.
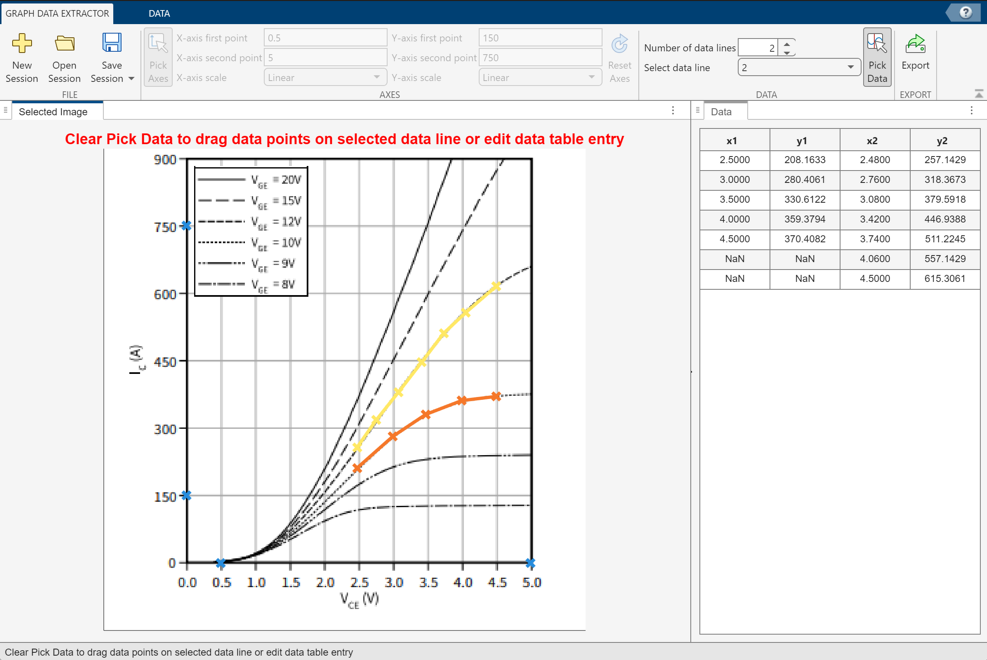
The app marks the selected points in yellow and adds columns x2 and y2 to the table. These columns contain the X and Y coordinates for each point on the second line.
Note that there are seven points on the second line and only five points on the first line, therefore the table contains empty (
NaN) cells at the bottom of the x1 and y1 columns.To plot both lines on a grid along the X axis, in the Graph Data Extractor toolstrip, click the Data tab.
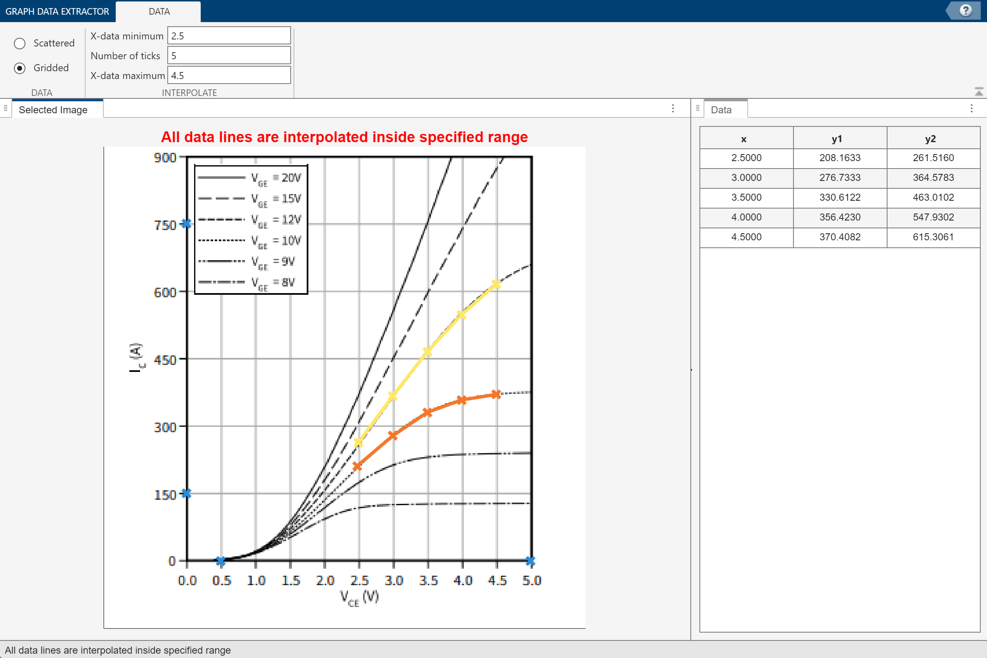
Click the Gridded radio button and then click Interpolate.
The app interpolates both curves between the minimum and maximum X values, with each curve now having seven points with equidistant positions along the X axis. The data table now contains only three columns: x (common for both curves), y1, and y2.
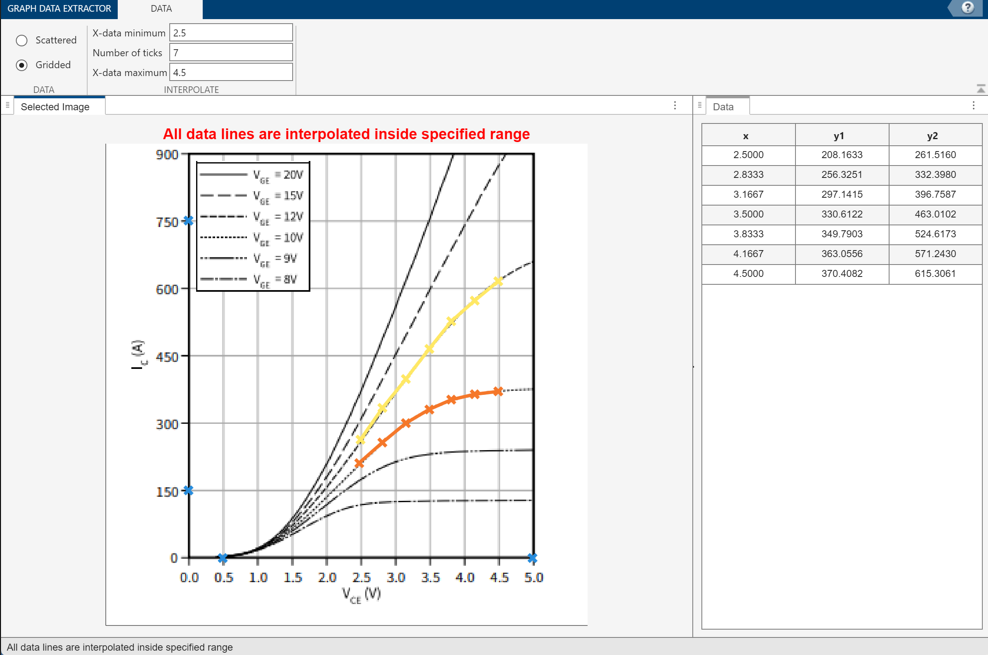
Note that if you try to adjust the point positions, you can now only move them along the Y axis, because the X value stays the same.
The toolstrip fields X-Data Minimum and X-Data Maximum display the interpolation range. The Number of Ticks field specifies the number of grid points along the X axis. To align the data to the grid on the plot, change the Number of Ticks value to
5.The app once more interpolates both curves, with each curve now having five points. The data table contains five rows of data.
When satisfied with the data table, click Export and specify the file name
IGBT_plot2.
Related Examples
- Parameterizing Blocks from Data Sheets (Simscape Electrical)
- Extract MOSFET Data from Data Sheet Using Graph Data Extractor (Simscape Electrical)