Interpret Code Prover Results in Polyspace Access Web Interface
When you open the results of a Polyspace® Code Prover™ analysis, you see a list on the Results List pane. The list consists of run-time checks, coding rule violations, code metrics and global variable usage.
You can first narrow down the focus of your review:
Use filters in the toolstrip to narrow down the list. For instance, you can focus on the high-impact defects.
Click the a column header in the Results List to sort the list according to the content of that column. For instance you can sort by Group or by File.
Because the results of a Code Prover run-time check are dependent on the results of previous checks, it helps to go through run-time checks from the beginning to the end of a function.
See also Filter and Sort Results in Polyspace Access Web Interface. Once you narrow down the list, you can begin reviewing individual results. This topic describes how to review a result.
To begin your review, select a result in the list.
Interpret Result
Interpret Message
The first step is to understand what the issue is. Read the message on the Result Details pane and the related line of code on the Source Code pane.

The message consists of several parts:
Check color and icon: See Code Prover Result and Source Code Colors (Polyspace Code Prover). In case of checks for run-time errors:
 : Red indicates a definite error.
 : Orange indicates a possible error.
 : Gray indicates unreachable code.
 : Green indicates that a specific error cannot
happen.
: Green indicates that a specific error cannot
happen.
Description of the run-time check.
In the preceding example, the check determines if an array index goes outside the array bounds.
Values relevant to the run-time check.
In the example, the message states the array size (127), the array bounds (0..126), and the range of values that the array index variable can take at that point in the code (0..555).
Relevant sources of imprecision (for orange checks).
In the example, the message states that two volatile variables might be responsible for the check.
See Variable Ranges in Source Code Tooltips
On the Source Code pane, variables and operations with tooltips are underlined.
![]()
In this example, tooltips appear on:
s8_ret: You see its data type and range of values before the+operation.If a data type conversion occurs during the + operation, you also see this conversion in the tooltip.
+: You see the value of the left and right operand, and the result.=: You see any data type conversion that occurs during the assignment and the result.
Get Additional Help
Sometimes, you need additional help for certain results. To open a help page for the
selected result, click the ![]() icon. See code examples that illustrate the result.
icon. See code examples that illustrate the result.
Find Root Cause of Result
Sometimes, the root cause might be far from the actual location where the result is
displayed. For instance, a variable that you read might be non-initialized because the
initialization is not reachable. The defect is shown when you read the variable, but the
root cause is possibly a previous if or while
condition that is always false.
Navigate in Source Code
Sometimes, the Result Details pane shows one sequence of events that leads to the result. However, in most situations, you have to find your own navigation pathways through the code. Using tooltips on variables, follow the propagation of variable ranges as you navigate through the code.
int func (int var) { /* Initial range of var */
     …
     var -= get ();  /* New range of var */
     …
     set(&var);     /* New range of var */
}
Use these quick navigation pathways in the user interface:
Search for all references to a variable and browse through them.
Right-click the variable name on the Source Code pane and select Search For All References. The options show only instances of a specific variable and not other variables with the same name in other scopes.
Navigate from a function call to its definition.
Right-click the function name on the Source Code pane. Select Go To Definition.
Navigate from a function to its callers and callees.
Click the
 icon on the Result Details
pane. You see the function containing the result, with its callers and callees.
Click a caller or callee name to navigate to the call site. Double-click a name to
navigate to the definition.
icon on the Result Details
pane. You see the function containing the result, with its callers and callees.
Click a caller or callee name to navigate to the call site. Double-click a name to
navigate to the definition.Click the
 icon to see a graphical representation of the call
sequence leading to the result. To navigate to functions in this sequence, click
through nodes in the graph.
icon to see a graphical representation of the call
sequence leading to the result. To navigate to functions in this sequence, click
through nodes in the graph.Navigate from a function call or loop keyword to an error in the function or loop body.
If the error occurs only in a specific function call or specific loop iteration, the function call or loop iteration is highlighted red. Right-click the red function call or loop keyword. Select Go To Cause if the option is available.
Before you begin navigating through pathways in your code, determine what you are looking for and choose the appropriate navigation tool. For instance:
To investigate a Non-initialized variable check, you might want to make sure that the variable is not initialized at all. Look for previous instances of the variable and see if it is initialized.
To investigate a violation of MISRA C:2012 Rule 17.7:
you might want to navigate from a function call to the function definition.The value returned by a function having non-void return type shall be used.
For other examples of what to look for, see Reviewing Code Prover Run-Time Checks (Polyspace Code Prover).
If you navigate away from the current result in the Source Code
pane, click the ![]() icon in the Result Details pane to
return to the location of the result in the Source Code pane.
icon in the Result Details pane to
return to the location of the result in the Source Code pane.
If you click a source code token containing a result, the previous result selection on
the Results List and details on the Result
Details pane do not change. You can keep the result in the results list and
the result details pinned while navigating in the source code. Sometimes, you might want
to see the result associated with a token. To update the result selection and the details,
Ctrl-click the token or right-click and select Select
Results At This Location.
Store Source Code Pane Navigation and Polyspace Actions
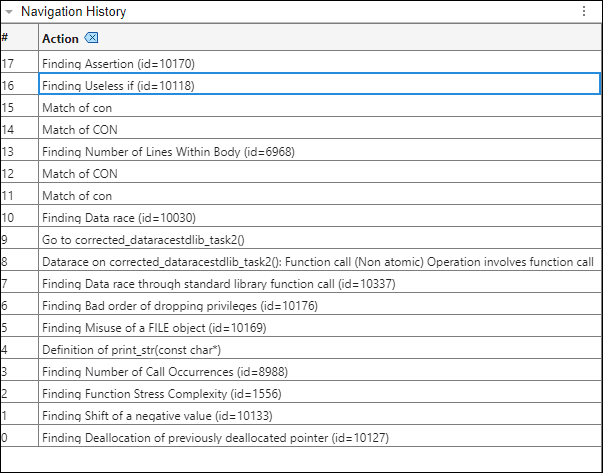
Polyspace displays certain review workflow actions in the Navigation History pane.
Click on an action in the Navigation History pane to open the relevant result in the Result Details pane. Then navigate within the Source Code pane to the location of the code associated with the action. As you continue your results review process, use the Navigation History pane to refer back to previous results and locate the associated code in the Source Code pane.
The actions Polyspace records include:
Selecting a result in the Results List pane
Selecting Keep position in Navigation History from the Source Code pane right-click menu
Selecting a node in a graph, such as the Error Call Graph or the Variable Access Graph
Selecting a row in the Code Search, Call Hierarchy, Global Variable Usage, or Global Variable Accesses panes
Flag an important action in the Navigation History pane by clicking the row number of the action.
Click the ![]() icon to remove all actions from the Navigation
History pane.
icon to remove all actions from the Navigation
History pane.