Phase Noise Profile from Time Domain Signal
Load the time domain signal represented by the time and signal value vectors.
load time_1.mat;
load signal_1.mat;
Set the resolution bandwidth of the spectrum analysis to 75 kHz. The frequency offset points are 100 kHz, 300 kHz, 500kHz, 1 MHz, 3 MHz, and 10 MHz. The target phase noise profile corresponding to these frequency offset points is:
-130 dBc/Hz at 100 kHz
-140 dBc/Hz at 300 kHz
-135 dBc/Hz at 500 kHz
-130 dBc/Hz at 1 MHz
-140 dBc/Hz at 3 MHz
-155 dBc/Hz at 10 MHz
rbw = 75e3;
FrOffset = [100e3 300e3 500e3 1e6 3e6 10e6];
PNTarget = [-130 -140 -135 -130 -140 -155];
Use the phaseNoiseMeasure function to measure and plot the phase noise profile.
[PNMeasure] = phaseNoiseMeasure(t,x,rbw,FrOffset,'on','Phase noise',PNTarget,'Type','Time','Histogram','on')
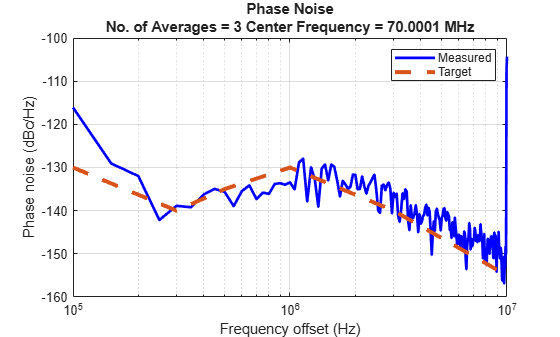
PNMeasure = 6×1

 -116.0947
 -138.8840
 -135.6692
 -133.4506
 -135.8644
 -104.3224