Implement Property Set Listeners
R2026bThis example shows how to define a listener for a property set event. The listener triggers when the value of the specified property changes. The callback function of the listener then updates a figure based on that property change.
DataSetWithPlot Class Overview
This class DataSetWithPlot defines a Data
property that holds a 2-by-n array of numeric data. The
visualize method plots the values in Data and
also defines a listener to respond to changes in Data. The callback
function updateFigureData updates the plot with the new
data.
classdef DataSetWithPlot < handle
    properties (SetObservable)
        Data (2,:) {mustBeNumeric}
    end

    methods
        function obj = DataSetWithPlot(initialData)
           obj.Data = initialData;
        end

        function visualize(obj)
            f = plot(obj.Data(1,:),obj.Data(2,:));
            dataChangedListener = listener(obj,"Data","PostSet",@(~,evtData)updateFigureData(f,evtData.AffectedObject.Data));
            f.UserData = dataChangedListener;
        end
    end
end
function updateFigureData(fig,data)
    fig.XData = data(1,:);
    fig.YData = data(2,:);
end
Event and Listener Design
The Data property is defined with the attribute
SetObservable set to true, enabling listeners
to respond to changes in its value. After plotting the data, the
visualize method defines the listener
dataChangedListener and assigns that listener to the
UserData property of the figure..
dataChangedListener = listener(obj,"Data","PostSet",@(~,evtData)updateFigureData(f,evtData.AffectedObject.Data));
f.UserData = dataChangedListener;
The listener object,
dataChangedListener, is defined using thelistenermethod ofhandle. The listener responds to thePostSetevent for theDataproperty.PostSetis a predefined MATLAB® event that fires after the value of a property is set.The callback function,
updateFigureData, updates an existing plot with the new data. The callback function does not need any information from the source argument (which in this case is thematlab.metadata.Propertyinstance for theDataproperty), so the listener does not pass that information to the callback. The callback takes the handle for the figure (f) and the new value forDataas inputs. The value ofDatais passed in through an instance ofevent.PropertyEvent, which holds aDataSetWithPlotinstance in itsAffectedObjectproperty.Unlike the addlistener method, the
listenermethod does not bind the listener lifecycle to the event source. The listener object is stored in theUserDataproperty of the figure, so when the figure is deleted, the listener is also deleted.
Test DataSetWithPlot
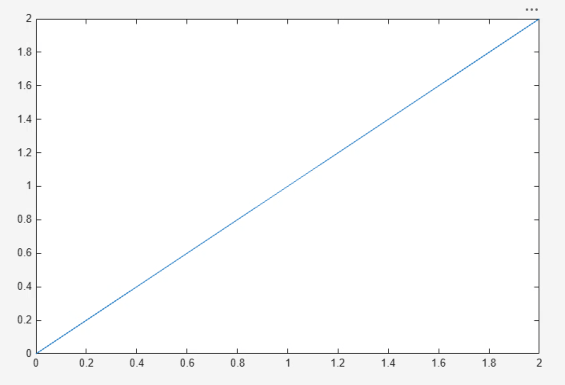
Create a DataSetWithPlot instance and call the
visualize method.
d = DataSetWithPlot([0 2; 0 2]);
d.visualize
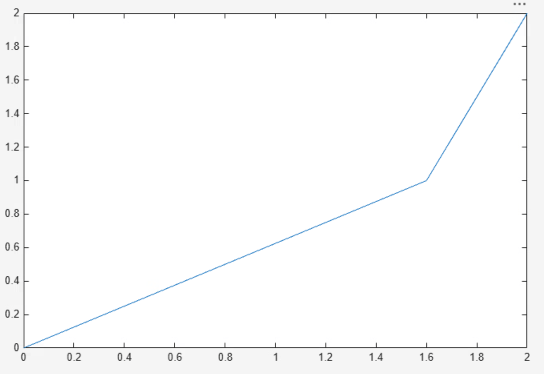
Change the Data property of d. The
PostSet event fires and the listener calls
updateFigureData. The existing figure is updated with the new
value of Data.
d.Data = [0 1.6 2; 0 1 2];