Highlight Specific Contour Levels
This example shows how to highlight contours at particular levels.
Define Z as the matrix returned from the peaks function.
Z = peaks(100);
Round the minimum and maximum data values in Z and store these values in zmin and zmax, respectively. Define zlevs as 40 values between zmin and zmax.
zmin = floor(min(Z(:)));
zmax = ceil(max(Z(:)));
zinc = (zmax - zmin) / 40;
zlevs = zmin:zinc:zmax;
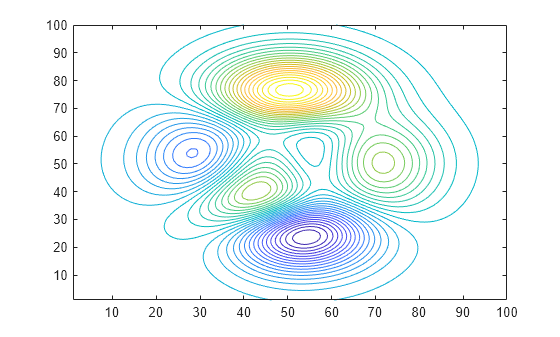
Plot the contour lines.
figure
contour(Z,zlevs)
Define zindex as a vector of integer values between zmin and zmax indexed by 2.
zindex = zmin:2:zmax;
Retain the previous contour plot. Create a second contour plot and use zindex to highlight contour lines at every other integer value. Set the line width to 2.
hold on
contour(Z,zindex,'LineWidth',2)
hold off
