Web Map Migration Strategies
Web maps, including functions such as webmap,
wmmarker, and wmline, will be removed in a
future release. Use geographic axes instead. This topic provides strategies for updating
your code to use geographic axes.
Benefits of Geographic Axes
Unlike web maps, geographic axes enable you to:
Display data using additional plot types, including density plots and bubble charts. For examples, see Create Maps Using Latitude and Longitude Data.
Customize your maps using MATLAB® graphics functions. For examples, see Add Labels and Annotations to Geographic Axes and Customize Appearance of Geographic Axes.
Build apps using App Designer. For an example, see Create Geographic Axes in App.
Replacement Functions
These web map functions will be removed in a future release. To update your code, replace uses of the web map functions with geographic axes functions.
| To Be Removed | Recommended |
|---|---|
webmap | Use a geographic axes object.
For detailed replacement patterns, see the Version History section of the |
wmmarker | Use the For
detailed replacement patterns, see the Version History section of the |
wmline | Use the For detailed
replacement patterns, see the Version History section of the |
wmpolygon | Use a For detailed
replacement patterns, see the Version History section of the |
wmremove | Use the For detailed replacement patterns, see
the Version History section of the |
wmcenter | Use the For detailed replacement
patterns, see the Version History section of the |
wmzoom | Use the For detailed replacement
patterns, see the Version History section of the |
wmlimits | Use the For
detailed replacement patterns, see the Version History section of the |
wmclose | Use the For detailed replacement patterns, see
the Version History section of the |
wmprint | Use an export option from Compare Ways to Export Graphics from Figures. |
Update Code to Use Geographic Axes
In many cases, you can update your code to use geographic axes by following these steps:
Add base layers that are not available as predefined basemaps by using the
addCustomBasemapfunction.Replace uses of the
webmapfunction with a function that creates a geographic axes object. For example, you can create a geographic axes object with a specified basemap by using thegeobasemapfunction.If you want to display multiple graphics objects in the same geographic axes object, set the hold state to
onby using theholdfunction.Replace uses of the
wmmarkerfunction with thegeoiconchartfunction.Replace uses of the
wmlinefunction with thegeoplotfunction.Replace uses of the
wmpolygonfunction with ageopolyshapeobject and thegeoplotfunction.Replace uses of the
wmlimitsfunction with thegeolimitsfunction.
The steps in this table create similar maps using web map functions and geographic axes functions.
| Step | Web Map (To Be Removed) | Geographic Axes (Recommended) |
|---|---|---|
| Add base layers that are not available as predefined basemaps. | Not applicable. | Add a custom basemap from OpenStreetMap® by using the
basemapName = "openstreetmap"; url = "a.tile.openstreetmap.org/${z}/${x}/${y}.png"; attribution = char(uint8(169)) + "OpenStreetMap contributors"; addCustomBasemap(basemapName,url,Attribution=attribution) |
Create a map that uses a specified basemap. | Create a web map that uses the OpenStreetMap basemap by using the
webmap("OpenStreetMap") | Create a geographic axes object that uses the
OpenStreetMap basemap by using the
figure
geobasemap openstreetmap |
| Prepare to display multiple graphics objects on the same map. | Not applicable. | Prepare to add additional data to the map by setting
the hold state of the axes to
hold on |
Display a marker on the map. | Display a marker by using the
wmmarker(42.3557,-71.0662) | Display an icon by using the
geoiconchart(42.3557,-71.0662,SizeData=32) |
Display a line on the map. | Specify the coordinates of a line. Display the line by
using the
lineLat = [42.3536 42.3548 42.3561 42.3573]; lineLon = [-71.0656 -71.0665 -71.0632 -71.0637]; wmline(lineLat,lineLon) | Specify the coordinates of a line. Display the line by
using the
lineLat = [42.3536 42.3548 42.3561 42.3573];
lineLon = [-71.0656 -71.0665 -71.0632 -71.0637];

geoplot(lineLat,lineLon,LineWidth=2,Color="k") |
Display a polygon on the map. | Specify the latitude and longitude coordinates of the
polygon. Display the polygon by using the
polyLat = [42.3554 42.3560 42.3527 42.3520 42.3554]; polyLon = [-71.0722 -71.0695 -71.0678 -71.0707 -71.0722]; wmpolygon(polyLat,polyLon,FaceAlpha=0.35) | Create a polygon shape from latitude and longitude
coordinates by using the
polyLat = [42.3554 42.3560 42.3527 42.3520 42.3554]; polyLon = [-71.0722 -71.0695 -71.0678 -71.0707 -71.0722]; shape = geopolyshape(polyLat,polyLon); geoplot(shape,FaceColor=[0 0 0]) |
Change the geographic limits of the map. | Specify new latitude and longitude limits. Change the
limits of the map by using the
latlim = [42.3518 42.3577]; lonlim = [-71.0735 -71.0609]; wmlimits(latlim,lonlim) | Specify new latitude and longitude limits. Change the
limits of the map by using the
latlim = [42.3518 42.3577]; lonlim = [-71.0735 -71.0609]; geolimits(latlim,lonlim) |
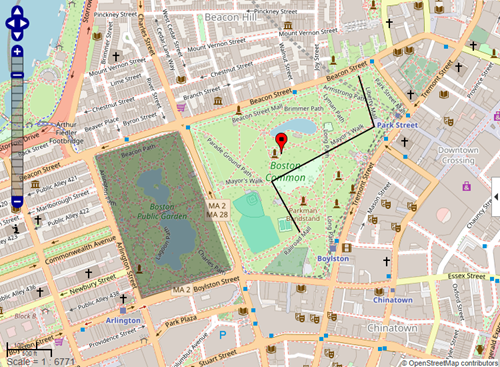
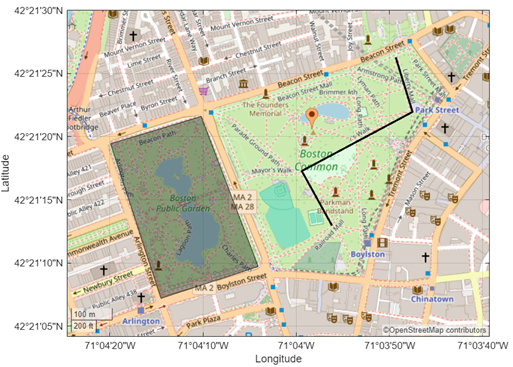
| View the map. |
|
|
Interact with Geographic Axes
Like web maps, you can interactively explore geographic axes by panning and zooming. Pan by dragging or by using the arrow keys. Zoom by scrolling or by using the Plus and Minus keys. For more information about controlling the interactivity of axes objects, see Control Chart Interactivity.
By default, geographic axes do not include interactive controls for selecting a basemap, navigating the map, or identifying the coordinates of the pointer. For an example that shows how to add interactive controls to geographic axes, see Add Interactive Controls to Geographic Axes.