Subscribe Nodes to Monitor and Plot Data Change in OPC UA Explorer
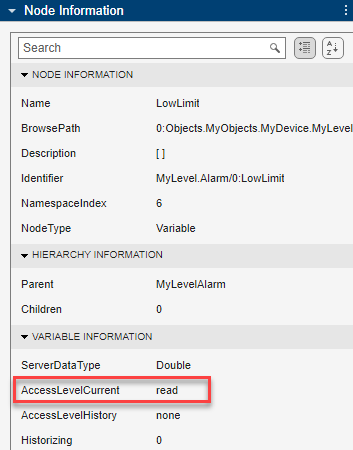
You can subscribe to nodes in the address space using the OPC UA Explorer app. When you select a node in the Address Space, the Node Information panel on the right displays the properties of the node. You can subscribe only to nodes with read access. For information about your access level, check the AccessLevelCurrent field in the Node Information panel.
Before you subscribe to nodes for data change notifications, configure and connect to the server. For more information, see Configure Server Connection in OPC UA Explorer App.
Subscribe to Nodes for Data Change Using Node Monitoring Table
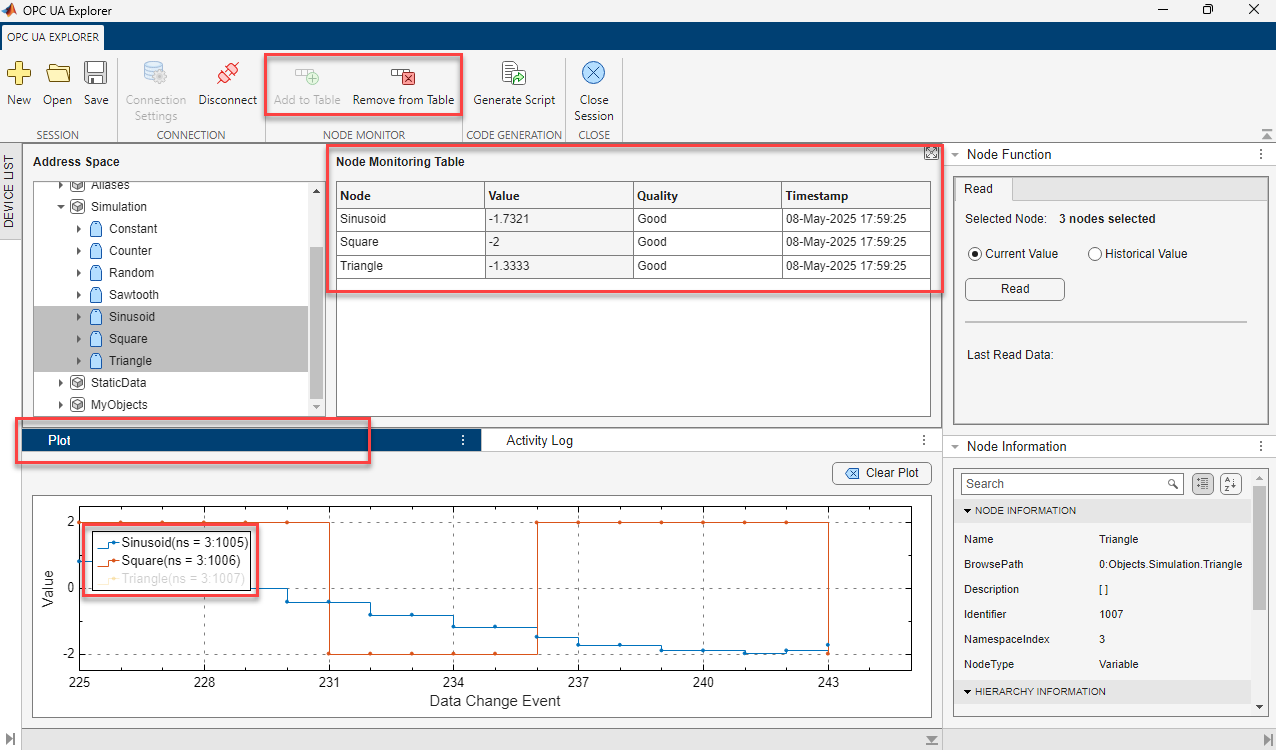
To subscribe to a node, select the node from the Address Space. Then, click Add to Table on the toolstrip, or double-click the node. This action adds the node to the Node Monitoring Table. The table displays the name, value, quality, and timestamp for each subscribed node. The app uses OPC UA subscription to monitor data changes and updates the value, quality, and timestamp for each corresponding node in the Node Monitoring Table. You can subscribe to and monitor several nodes at once.
If you have write access to a subscribed node, use the Value column in the Node Monitoring Table to write a value directly to that node.
To save a session with the current Node Monitoring Table, click Save on the toolstrip. To open a session with a previously saved Node Monitoring Table, click Open and select the saved OPC UA session file.
Monitor Node Data Change Graphically
To monitor the data graphically, select the Plot tab in the bottom panel of the app window. The plot shows data changes for the nodes in the Node Monitoring Table, only if these nodes have scalar numeric data.
This example monitors data changes in Sinusoid,
Square, and Triangle nodes using the
Node Monitoring Table. You can also monitor these nodes
graphically because they contain scalar numeric data. When data changes occur at any
of the subscribed nodes, the plot updates all data entries. To hide a data line,
click its legend in the plot. In this example, the plot disables the data line for
the Triangle node. To show the data line, click the greyed-out
legend.