Case Study for Life Tables Analysis
This example shows how to use the basic workflow for life tables.
Load the life table data file.
load us_lifetable_2009Calibrate life table from survival data with the default heligman-pollard parametric model.
a = lifetablefit(x, lx);
Generate life table series from the calibrated mortality model.
qx = lifetablegen((0:100), a);
display(qx(1:40,:))
    0.0063    0.0069    0.0057
    0.0005    0.0006    0.0004
    0.0002    0.0003    0.0002
    0.0002    0.0002    0.0002
    0.0001    0.0001    0.0001
    0.0001    0.0001    0.0001
    0.0001    0.0001    0.0001
    0.0001    0.0001    0.0001
    0.0001    0.0001    0.0001
    0.0001    0.0001    0.0001
    0.0001    0.0001    0.0001
    0.0001    0.0001    0.0001
    0.0002    0.0002    0.0001
    0.0002    0.0002    0.0002
    0.0002    0.0003    0.0002
    0.0003    0.0004    0.0002
    0.0004    0.0005    0.0002
    0.0005    0.0006    0.0003
    0.0006    0.0008    0.0003
    0.0007    0.0009    0.0003
    0.0008    0.0011    0.0003
    0.0008    0.0012    0.0004
    0.0009    0.0013    0.0004
    0.0009    0.0014    0.0005
    0.0010    0.0014    0.0005
    0.0010    0.0015    0.0005
    0.0010    0.0015    0.0006
    0.0010    0.0015    0.0006
    0.0010    0.0015    0.0007
    0.0010    0.0014    0.0007
    0.0011    0.0014    0.0007
    0.0011    0.0014    0.0008
    0.0011    0.0014    0.0008
    0.0011    0.0014    0.0009
    0.0011    0.0014    0.0009
    0.0012    0.0015    0.0010
    0.0012    0.0015    0.0011
    0.0013    0.0016    0.0011
    0.0014    0.0017    0.0012
    0.0015    0.0018    0.0013
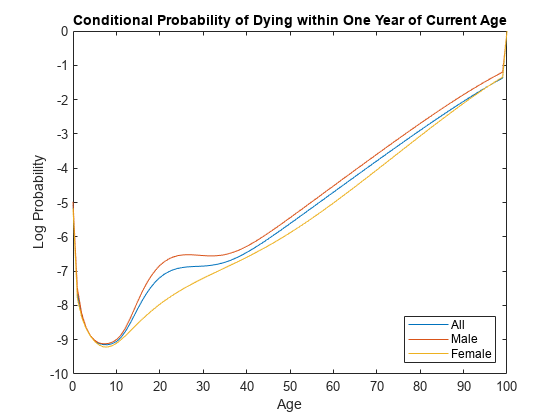
Plot the qx series and display the legend. The series qx is the conditional probability that a person at age will die between age and the next age in the series
plot((0:100), log(qx));
legend(series, 'location', 'southeast');
title('Conditional Probability of Dying within One Year of Current Age');
xlabel('Age');
ylabel('Log Probability');

See Also
lifetableconv | lifetablefit | lifetablegen