generateScript
R2026bGenerate MATLAB script to create scope with current settings
Syntax
Description
generateScript( generates a MATLAB® script that can recreate a scope object with the current settings in the
scope. scope)
Examples
Create a
spectrumAnalyzerobject.scope = spectrumAnalyzer(); show(scope);
Set options in the Spectrum Analyzer. For this example, select both Spectrum and Spectrogram in the Home tab of the Spectrum Analyzer toolstrip.
In addition, click the Spectrum drop-down arrow, and select the Max-Hold Trace and Min-Hold Trace parameters.
Generate a script to recreate the
spectrumAnalyzerwith the modified settings. Either click Generate Script from the Export drop-down in the Home tab, or enter this command in the MATLAB command prompt.generateScript(scope);
A new editor window opens with code to regenerate the same scope.
% Generated by MATLAB(R) 26.2 (R2026b) and DSP System Toolbox 26.2 (R2026b).
% Generated on 16-Mar-2026 17:24:04 -0400.

% Construct a spectrumAnalyzer object
specScope=spectrumAnalyzer(ViewType="spectrum-and-spectrogram", ...
    PlotMaxHoldTrace=true, ...
    PlotMinHoldTrace=true, ...
    Position=[282 150 800 500]);
Create a
dsp.ArrayPlotobject.scope = dsp.ArrayPlot(); show(scope);
Set options in the Array Plot. For this example, from the Measurements tab, turn on the Data Cursors. From the Scope tab, turn on Legend. Click Settings. Select Magnitude Phase Plot, and specify an x-axis label and a title.
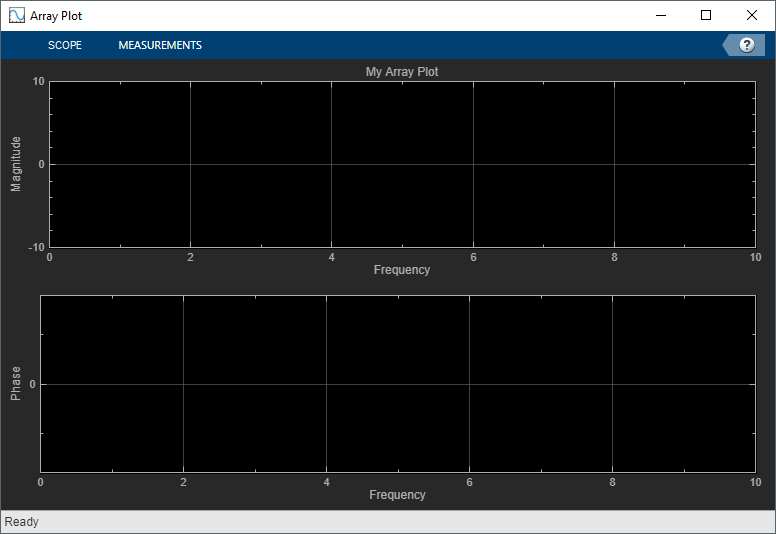
Generate a script to recreate the
dsp.ArrayPlotwith the same modified settings. Either select Generate Script from the Scope tab, or enter the following in the MATLAB command prompt:generateScript(scope);
A new editor window opens with code to regenerate the same scope.
% Generated by MATLAB(R) 24.2 (R2024b) and DSP System Toolbox 24.2 (R2024b).
% Generated on 24-Apr-2024 14:37:28 -0400.

% Construct a dsp.ArrayPlot object
arrayPlot=dsp.ArrayPlot(AxesScaling="Manual", ...
    Position=[2260 393 800 500], ...
    PlotAsMagnitudePhase=true, ...
    Title="My Array Plot", ...
    XLabel="Frequency", ...
    ShowLegend=true);
% Cursor Measurements Configuration
arrayPlot.CursorMeasurements.Enabled=true;
Create a
timescopeobject.scope = timescope; show(scope)
Set options in the Time Scope. For this example, on the Scope tab, click Settings. Under Display and Labels, select Show Legend and Magnitude Phase Plot. Set the Title as well.

Generate a script to recreate the
timescopewith the same modified settings. Either select Generate Script from the Scope tab, or enter the following in the MATLAB command prompt:generateScript(scope);
A new editor window opens with code to regenerate the same scope.
% Generated by MATLAB(R) 26.2 (R2026b) and DSP System Toolbox 26.2 (R2026b).
% Generated on 18-Jun-2026 14:47:07 -0400.

% Construct a timescope object
timeScope=timescope(Position=[2224 151 800 500], ...
    PlotAsMagnitudePhase=true, ...
    Title="My Time Scope", ...
    ShowLegend=true);
Input Arguments
Version History
Introduced in R2019aSee Also
spectrumAnalyzer | dsp.ArrayPlot | timescope | dsp.DynamicFilterVisualizer

