Create an App for Live Data Acquisition
R2026bThis example shows how to create a live data acquisition app by using Data Acquisition Toolbox™ and App Designer. The app connects to a DAQ device or sound card, displays a real-time scrolling plot of acquired data, and logs data to a MAT file.
Live data acquisition with logging enables you to monitor signals in real time while recording measurements for later analysis. For example, you can visualize sensor data as it streams in and simultaneously save it to disk for post-processing.
The example opens the app in Design View of App Designer. To run the app, click Run in App Designer, or run the app from the MATLAB® command line by entering LiveDataAcquisition.
App Description
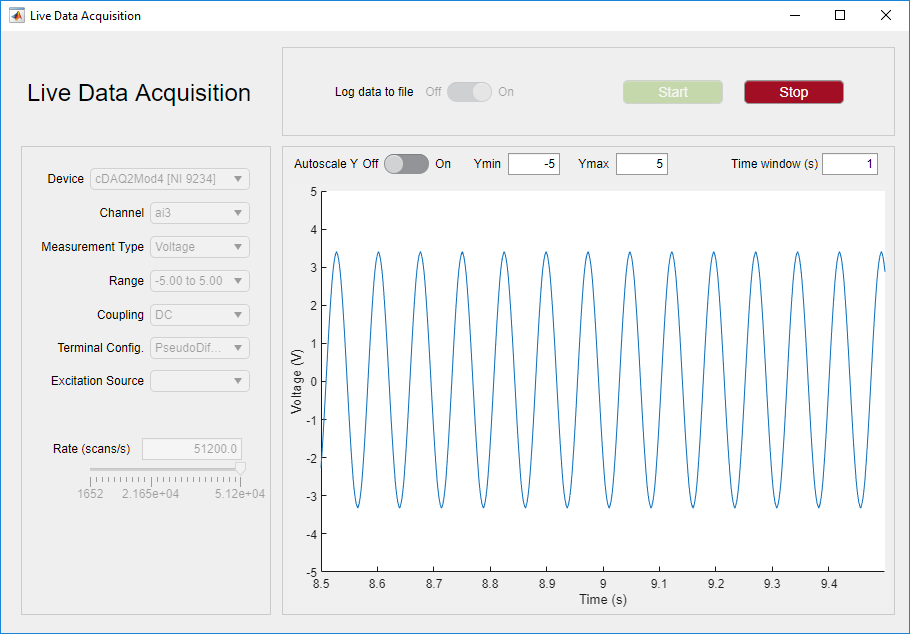
The LiveDataAcquisition app contains three panels:
Device and Channel Configuration (left panel) — Select a connected DAQ device, choose an analog input channel, and configure measurement type, range, coupling, terminal configuration, excitation source, and scan rate. Click Start to begin continuous acquisition or Stop to end it.
Live Data Display (right panel) — Displays a real-time scrolling plot of the acquired signal. Configure the visible time window and toggle Y-axis autoscaling or set explicit Y-axis limits.
Data Logging (top-right panel) — Toggle the Log data to file switch to enable data logging. When enabled, the app writes acquired data to an intermediate binary file during acquisition. When you stop acquisition, the app automatically converts the binary file to a MAT file.
Data Logging Approach
Logging acquired data during a live acquisition session requires a strategy that does not block the real-time display. This app uses a two-step approach:
During acquisition — The app writes data incrementally to a temporary binary file using low-level file I/O (
fwrite). Binary writes are fast and do not introduce delays that could disrupt the live plot update.After acquisition stops — The
binFile2MATfunction converts the binary file to a MAT file. This function reads the binary data in manageable chunks and saves it as atimetablewith timestamps and measurement data.
This approach avoids loading all data into memory at once, making it suitable for long-duration acquisitions.
App States for Controlling Operation
The app uses a state machine pattern to manage its operating modes. The CurrentState property tracks the active state, and the setAppViewState function enables or disables UI components based on the current state. The following list describes each state, when it becomes active, and the actions available in that state:
deviceselection— Active on app startup. You can select a DAQ device from the drop-down list.configuration— Active after you select a device. You can configure channel properties and scan rate.acquisition— Active after you click Start. The app acquires data continuously and updates the live plot in real time. Data logging occurs if enabled.filesave— Active after you click Stop with logging enabled. The app converts the binary file to a MAT file.
App Functions and Callbacks
This section describes the core functions and callbacks. Open the app in Code View in App Designer to view all callbacks, functions, and properties. Use the Code Browser pane to navigate the code.
scansAvailable_Callback Function
This callback executes periodically as the DataAcquisition object acquires data. It reads new data using the read function, stores it in a FIFO buffer, and updates the live scrolling plot. If data logging is enabled, the callback writes the new data block to the binary file using fwrite.
storeDataInFIFO Function
This function manages a finite-size circular buffer for continuous acquisition data. It appends new data and discards the oldest data to maintain a fixed buffer size determined by the time window and scan rate. This approach enables smooth live plotting without continuously increasing memory use.
binFile2MAT Function
This function converts the intermediate binary file to a MAT file after acquisition stops. It reads data in chunks to avoid loading the entire file into memory. Finally, the function saves timestamps and measurement data along with metadata (channel info, scan rate) to the output MAT file.
setAppViewState Function
This function transitions the app between states by enabling or disabling groups of UI components. For example, during acquisition, the app disables device configuration controls to prevent changes while it collects data.
closeApp_Callback Function
This callback handles app close requests. If acquisition is in progress, it stops the DAQ, closes any open binary file, and cleans up resources before closing the app figure.
Callbacks for UI Components
The following list describes each UI component, its callback, and its behavior:
Device drop-down list (
DeviceDropDownValueChanged) — When you select a device, the callback populates channel and measurement options and creates a DAQ object usingdaqandaddinput.Channel drop-down list (
ChannelDropDownValueChanged) — When you select a channel, the callback updates available measurement types and channel properties.Start button (
StartButtonPushed) — When you click Start, the callback creates FIFO buffers, opens a binary file if logging is enabled, configures theScansAvailableFcncallback, and starts background acquisition usingstart.Stop button (
StopButtonPushed) — When you click Stop, the callback stops acquisition usingstop, closes the binary file, converts it to MAT if logging was enabled, and resets to Configuration state.Log data switch (
LogdatatofileSwitchValueChanged) — When you toggle the switch, the callback enables or disables data logging to file.Rate controls (
RateSliderValueChanged) — When you change the scan rate, the callback updates the DAQ scan rate and recalculates the FIFO buffer size.Autoscale Y switch (
AutoscaleYSwitchValueChanged) — When you toggle the switch, the callback enables or disables Y-axis autoscaling on the live plot.

