Characterize an LED with ADALM1000
R2026bThis example shows how to use MATLAB® to connect to an Analog Devices ADALM1000 source-measurement unit, configure it, and make current and voltage measurements to characterize an LED.
Discover Supported Data Acquisition Devices Connected to Your System
daqlist
ans = 1×5 table
    "adi"    "SMU1"    "Analog Devices Inc. ADALM1000"    "ADALM1000"    1×1 DeviceInfo
Create a DataAcquisition Interface for the ADALM1000 Device
ADIDaq = daq("adi");Add Channels for Sourcing Voltage and Measuring Current
The ADALM1000 device can source voltage and measure current simultaneously on the same channel. Set up the device in this mode.
Add an analog output channel with device ID SMU1 and channel ID A, and set its measurement type to voltage.
addoutput(ADIDaq,'smu1','a','Voltage');
Add an analog input channel with device ID SMU1 and channel ID A, and set its measurement type to current.
addinput(ADIDaq,'smu1','a','Current');
Confirm the configuration of the channels.
ADIDaq.Channels
ans = 1×2 object
    1×1 AnalogOutputVoltageChannel    1×1 AnalogInputCurrentChannel
Blink Attached LED Five Times
Connect an LED in series with a 330- resistor between the ADALM1000 channel A and ground. Alternately apply 5 V and 0 V.
for iLoop = 1:5
    % Turn on LED by generating an output of 5 volts.
    write(ADIDaq,5);
    pause(0.2);
    % Turn off LED by generating an output of 0 volts.
    write(ADIDaq,0);
    pause(0.2);
end
Characterize the LED
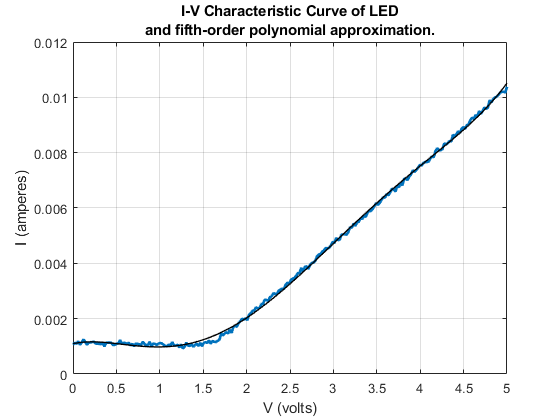
To understand the LED I-V characteristics, sweep a range of voltage values from 0 V to 5 V, and measure the current for each value. The aggregate of all measurements provides data to graph the current across the LED over a range of voltages.
v = linspace(0,5,250)';
i = readwrite(ADIDaq,v,"OutputFormat","Matrix");
Plot the Characteristic Curve of the LED and Estimate a Mathematical Model
When you have the measured data, you can visualize it. You can also calculate a mathematical model that approximates the behavior of the LED within the range of the measurements.
% Plot the measured data.
plot(v,i,'LineWidth',2);
hold on;
grid on;
ylabel('I (amperes)');
xlabel('V (volts)');
title({'I-V Characteristic Curve of LED';'and fifth-order polynomial approximation.'});
Fit the data using a fifth-order polynomial and overlay the acquired data with the model of the LED approximated by a fifth-order polynomial.
approxPoly = polyfit(v,i,5);
Plot the approximated data.
plot(v,polyval(approxPoly,v),'-k','Linewidth',1);
Calculate the Voltage at Which the LED Turns On
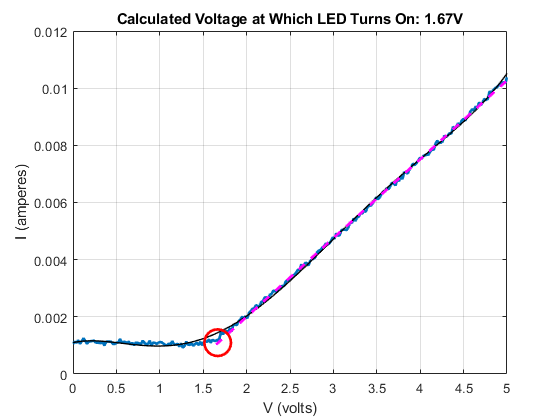
Based on the fifth-order polynomial approximation, you can find a first-order approximation that represents the linearly increasing portion of the curve. The voltage at which the LED turns on is approximately where this line intersects the voltage axis.
Find the line that passes through the linear portion of the signal.
normErr = -1;
errThreshold = 0.001;
numPointsForLine = numel(v) - 10;
while (numPointsForLine > 0) && (normErr < errThreshold)
    approximation = polyval(approxPoly,v(numPointsForLine:end));
    [linearPoly, errorStruct] = polyfit(v(numPointsForLine:end),approximation, 1);
    numPointsForLine = numPointsForLine - 5;
    normErr = errorStruct.normr;
end
Evaluate the linear polynomial over the range of measurements. The value where this intersects the horizontal line representing any leakage current is the voltage at which the LED turns on.
LEDThreshold = 1.2;
leakageCurrent = mean(i(v<LEDThreshold));
linearIV = polyval(linearPoly,v);
minIndex = sum(linearIV<leakageCurrent);
Plot the linear portion of the curve.
plot(v(minIndex-1:end),polyval(linearPoly,v(minIndex-1:end)),'Magenta','Linewidth',2,'LineStyle','--')
Circle the approximate voltage at which the LED turns on.
plot(v(minIndex),leakageCurrent,'o','Linewidth',2,'MarkerSize',20,'MarkerEdgeColor','Red')
title(sprintf('Calculated Voltage at Which LED Turns On: %1.2fV',v(minIndex)));
Turn Off the LED and Clear the DataAcquisition
write(ADIDaq,0);
close
clear ADIDaq
