Using Polyspace Platform as Default User Interface for Static Analysis
Starting in R2026a, the Polyspace Platform user interface is the default user interface for both static analysis and dynamic testing using Polyspace® products. If you are upgrading from an earlier release and used the classic Polyspace user interface for running static analysis, you can continue the same workflows in the Polyspace Platform user interface. In particular:
For new projects, you can simply open the Polyspace Platform user interface and start creating projects.
If you have projects created in the classic Polyspace user interface, you can open them in the Polyspace Platform user interface and start running Bug Finder or Code Prover on the projects.
This topic describes the initial changes you might experience in the user interface when upgrading to R2026a or later releases.
Opening Polyspace Platform User Interface and Creating Projects
If you are used to opening the classic Polyspace user interface, from R2026a onwards, the same actions open the Polyspace Platform user interface. You can start by creating a new project or opening an older project created in the classic Polyspace user interface. If one of your older workflows is not supported, you can also revert to using the classic Polyspace user interface as your default.
Open Polyspace Platform User Interface
If you create desktop shortcuts during installation of the Polyspace desktop products, open the Polyspace Platform user interface by double-clicking one of these shortcuts:
Polyspace R2026a
This shortcut is created when installing Polyspace Bug Finder™ or Polyspace Code Prover™.
Polyspace Test R2026a
This shortcut is created when installing Polyspace Test™.
Open the Polyspace Platform user interface by double-clicking or otherwise starting one of these executables in the folder polyspaceroot\polyspace\bin
polyspace-desktop-ui.exepolyspace.exe(since R2026a)
Here, polyspacerootC:\Program Files\Polyspace\R2026a.
Import Projects into Polyspace Platform User Interface
To migrate projects created in the classic Polyspace user interface (.psprj files):
With the Polyspace Platform user interface open, click Open in the toolstrip.
Select your
.psprjfile in the explorer window and click Open.A dialog box opens alerting you that the
.psprjfile will be imported as a.psprjxfile. Click Import to continue with the import.Select a location to save the resulting project file (
.psprjxfile) and click OK.
Instead of opening projects one at a time in the user interface, you can also batch-convert classic projects to Polyspace Platform projects from the command line. For more information, see polyspace-project
-convert-psprj-to-workspace.
The Polyspace Platform user interface uses the .psprjx file extension for project files and .pswks file extension for workspace files. If you import a classic project file (.psprj file) into the Polyspace Platform user interface:
A classic project with
nmodules is converted to a workspace withnprojects. In other words, the import creates a workspace file (.pswksfile) andnproject files (.psprjxfiles), wherenis the number of modules in the original.psprjfile.Files you list under Project Include Folders in your classic project appear in the Project tab in the configuration of the new project. For more information on include paths, see
Include paths (-I).The Bug Finder checkers specifications in the classic project are migrated to a checkers activation file. This file is then specified for the option
Checkers activation file (-checkers-activation-file).The target specifications in the classic project are migrated to a custom processor and specified for the processor option in the new project. For more information on processors, see
Processor.
Note the following:
Any change you make to your new project (
.psprjxfile) are not reflected in the original project (.psprjfile).You are not able to convert the new project back to the classic project format.
Revert to Classic User Interface
You can continue using the classic user interface if one of your older workflows is not supported in the Polyspace Platform user interface. To revert to the classic user interface:
On the Polyspace Platform toolstrip, select Settings.
In the Polyspace Platform Settings window, select the Static Analysis node. Then, clear the option Set Polyspace Platform as default user interface for static analysis.
Close the Polyspace Platform user interface.
Double-click the desktop shortcut Polyspace R2026a, or the executable
polyspaceroot\polyspace\bin\polyspace.exepolyspacerootC:\Program Files\Polyspace\R2026a.This action now opens the classic Polyspace user interface.
After making the classic user interface your default, you can continue to open the Polyspace Platform user interface by double-clicking the executable polyspaceroot\polyspace\bin\polyspace-desktop-ui.exe
In the classic user interface, select Try the New Desktop on the toolstrip.
In the dialog that opens, select the checkbox to set Polyspace Platform as your default user interface, and close the dialog.
Close the classic Polyspace user interface.
Double-click the desktop shortcut you used earlier to open the classic Polyspace user interface, or the executable
polyspaceroot\polyspace\bin\polyspace.exepolyspacerootC:\Program Files\Polyspace\R2026a.This action now opens the Polyspace Platform user interface.
Benefits of Using Polyspace Platform User Interface
Unlike the classic Polyspace user interface, which supported static analysis only, the Polyspace Platform user interface supports both static analysis and dynamic testing. In particular:
You can perform a single one-time setup for static analysis and dynamic testing.
You can view results of static analysis and dynamic testing on a common dashboard.
The static analysis products provide information that makes the dynamic testing workflow easier.
For more information, see Polyspace Platform: A Unified Platform for Static Analysis and Dynamic Testing.
If you use the Polyspace Platform user interface, you have access to certain features that are not available in the older user interface. These features include:
Viewing compile flags that are specific to each file. If you create a project from your build command, each file is associated with a set of compilation options such as include paths and defines. You can see these file-specific options in the Polyspace Platform user interface. From the Configuration pane, select the Build tab and then select File Specific Options. See Add Sources from Build Command.
Adding resources such as source files, external test files, include paths, and xUnit test files using relative paths. See Create Easily Shareable Projects for Version Control.
Creating a modular project structure and reusing single-sourced configurations by converting build, static analysis, and testing and profiling configurations to external
.pscfgfiles that you can reference from one or more projects. See Use External Configurations to Share Single-Sourced Configuration Variants. (since R2026a)Reviewing and justifying identical findings. If you check your code for multiple coding standards, you can review analysis results more efficiently by addressing violations of one coding standard. Polyspace identifies all identical rule violations from other standards at the same location in your code. You can copy the review information from the currently selected finding and apply it to the other identical findings or copy the review information and apply it to all the other identical findings. See Apply Existing Review Information to Identical Findings (Polyspace Access).
Authoring and running C/C++ tests in the Polyspace Platform user interface (requires a Polyspace Test license).
Performing Polyspace Bug Finder, Polyspace Code Prover, and Polyspace Test workflows at the same time from within the Polyspace Platform user interface. Review all results within the Polyspace Test Platform user interface or upload results to Polyspace Access™.
Checking for violations of a user-defined coding standard. User-defined coding standards allow you to collect coding rules that are relevant specifically to your project into a single standard when an existing coding standard does not exactly meet your needs. A user-defined coding standard is defined in a
.pschkfile. See Check for Violations of User-Defined Coding Standard Using Polyspace Bug Finder.Managing related projects by using workspaces. Workspaces can contain multiple projects with their own configuration and files. See Manage Related Projects in Polyspace Platform User Interface Using Workspaces.
Viewing project overview and review dashboards previously only available in Polyspace Access. See Dashboard in Polyspace Platform User Interface.
Comparing project, workspace, or configuration files before submitting to source control. Merge your project or configuration with the last checked in version in the repository and resolve conflicts that occur during the merge. See Compare and Merge Polyspace Platform Projects and Configurations Before Submission to Source Control (Polyspace Test).
Running Polyspace static analysis on a Mac computer with an Apple silicon processor. The older user interface is not supported on Apple silicon-based Mac computers.
Workflow Changes When Using Polyspace Platform User Interface
Some workflows in Polyspace Platform user interface differ from the corresponding workflows in the older user interface.
Running Polyspace Analysis on Generated Code After Integrating with Simulink
In this workflow, you integrate Polyspace with Simulink® and then use the Polyspace Code Verifier app to verify C/C++ code generated from a Simulink model directly from the Simulink toolstrip.
After the analysis of generated code completes, the results open in the Polyspace Platform user interface. You can interpret results, add justifications, and navigate from an issue back to model using the Polyspace Platform user Interface.
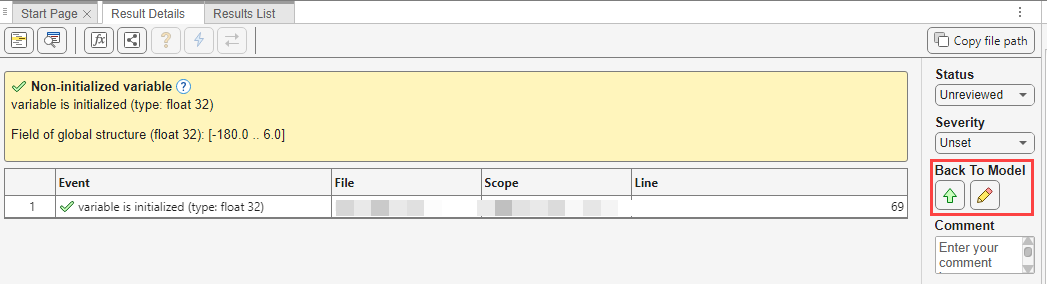
After you perform a Polyspace analysis using the Polyspace Code Verifier app, the Results Overview dashboard opens in the Polyspace Platform user interface. To review the results list, click Review. Using the results list, you can:
Navigate to the model directly from the Result Details pane by clicking the Go To Model button (). The Simulink block that causes the Polyspace result is highlighted in the Simulink editor.
Copy annotations from individual results in the Results Details pane to corresponding Simulink blocks by using the Annotate Block button (). The annotations you entered are copied as Polyspace Annotation to the Simulink block. If multiple Polyspace results correspond to the same block, annotation for each result is copied to the block separately.
See:
The workflow for specifying Polyspace configuration parameters and specifying a Polyspace project configuration remains unchanged. When you select Settings > Project Settings in the Polyspace section of the Simulink toolstrip, the new Polyspace Platform user interface opens.
Polyspace continues to prepopulate the options necessary to analyze generated code. Update the options in the Build and Static Analysis tabs of the Configuration pane to further configure your analysis.
The configuration parameter Use custom project file now supports .psprjx projects by default. The .psprj project templates remain supported.
For more details, see Configure Polyspace Options in Simulink.
Running Polyspace Code Prover on AUTOSAR Code
In this workflow, you create a Polyspace project corresponding to each software component of the AUTOSAR model and run Code Prover on the projects. The projects are contained in a Polyspace workspace. Each project in the workspace contains the source files implementing one software component. You can analyze each software component separately with their own configurations. For details about workspaces, see Manage Related Projects in Polyspace Platform User Interface Using Workspaces.
You can analyze the AUTOSAR code using the Polyspace Platform user interface by creating projects from the AUTOSAR specifications. In the Project toolstrip, select New > Workspace from AUTOSAR to start creating projects from AUTOSAR specification. For details, see Run Analysis in Polyspace Platform User Interface (Polyspace Code Prover).
You can also create projects and workspaces from AUTOSAR specification at the command line. Use the command polyspace-autosar with the option -output-platform-project. For example, say you have AUTOSAR source code in the folder codeFolder and ARXML specifications in the folder ProjectFolder. At the command line,
enter:
polyspace-autosar -create-project ProjectFolder -arxml-dir arxmlFolder\
 -sources-dir codeFolder -generate-autosar-headers -output-platform-project
ProjectFolder. By storing individual software components from AUTOSAR code into separate projects, Polyspace now allows you to configure each component individually. You can keep track of each component of your AUTOSAR code by monitoring the workspace. For details, see polyspace-autosar (Polyspace Code Prover).If you have a psprj project created from AUTOSAR specifications, you can import the project into a Polyspace workspace simply by opening the psprj project in the new Polyspace Platform user interface. Polyspace creates new projects (psprjx) and a workspace (pswks) in the same folder as the original psprj project. Each project in the new workspace correspond to a software component in the AUTOSAR specification. In psprj projects, these components corresponded to modules. After you import the AUTOSAR project in a workspace, avoid moving the original psprj file. Moving the original
psprj project file can invalidate some of the path related configurations.
Creating Projects with Multiple Modules
The Polyspace Platform user interface does not support multiple modules. Instead, create projects corresponding to each component of your code and use a workspace to monitor related projects. By separating code into independent projects, you can configure analysis for each project independently. For details about workspaces, see Manage Related Projects in Polyspace Platform User Interface Using Workspaces.
If you import a Polyspace project with multiple modules into the Polyspace Platform user interface, each module is converted into a separate project (with project names ending with _Module_1, _Module_2, and so on).
Additionally, in the older user interface you could run analysis on all modules at the same time. In the Polyspace Platform user interface, you run each project separately.
Capabilities Not Supported in Polyspace Platform User Interface
The Polyspace Platform user interface does not support certain capabilities available in the older user interface.
If you need to open the older user interface to perform these tasks in R2026a, use the -pve option when launching the polyspace.exe executable.
Run an Analysis on Ada Code
The Polyspace Platform user interface does not support Polyspace for Ada. To perform an analysis on Ada code, use the older user interface.
Analysis on Remote Clusters
The Polyspace Platform user interface does not provide a way to submit analysis jobs to another cluster. To send Code Prover or Bug Finder analysis jobs to a remote cluster, use the older user interface or follow the command line workflow. For more information see Send Polyspace Analysis from Desktop to Remote Servers Using Scripts.
Open Editor from Source Code Pane
The Polyspace Platform user interface does not provide a way to open a code editor from the Source Code pane in the Review perspective. You can right-click in the Source Code pane and select Copy File Path To Clipboard from the context menu. Use the path on your clipboard to open the file in your code editor.
See Also
polyspace-project -diff, polyspace-project -merge | polyspace-project -convert-psprj-to-workspace | polyspace-project -generate-launching-script-for