Using Machine Learning to Predict Epileptic Seizures from EEG Data
By Gareth Jones, University College of London
Approximately 20-40% of epileptic seizures do not respond to anticonvulsant medication. As a result, individuals with epilepsy have no way of knowing if a seizure will occur when they are driving, swimming, or engaged in some other activity that would make a seizure particularly dangerous.
A recent Kaggle competition addressed this issue by challenging participants to develop algorithms that could predict epileptic seizures from human intracranial electroencephalograph (EEG) recordings (Figure 1).

Figure 1. Intracranial EEG data provided by Kaggle.
Sponsored by MathWorks, the National Institutes of Health (NINDS), the American Epilepsy Society, and the University of Melbourne, the competition attracted 478 teams and 646 competitors from around the world.
The algorithms I developed in MATLAB® scored highest among individual participants and third highest in the competition overall.
Accessing and Preprocessing the EEG Data
The EEG data came from a long-term study conducted by the University of Melbourne.
In this study, intracranial EEG recordings were collected from 15 epileptic patients via 16 surgically implanted electrodes sampled at 400 Hz for several months. In the original study, researchers were unable to reliably predict seizures for about 50% of the test subjects.
Kaggle competition participants received almost 100 gigabytes of EEG data from three of the test subjects. Each ten-minute-long segment contained either preictal data, recorded before a seizure, or interictal data, recorded during a long period in which no seizures occurred. Our job was to develop algorithms that could classify previously unseen segments as either preictal or interictal.
Kaggle competitors were given free access to MATLAB, but use of MATLAB was not required. I decided early on that I would use MATLAB. The competition data was provided in MAT files, making it easy to access in MATLAB. In addition, I use MATLAB for data collection and analysis in all my research work.
I began by concatenating any sequential 10-minute-long segments (Figure 2). I then partitioned all the data into epochs, or windows, with lengths varying from 50 seconds to 400 seconds. It was important to try a variety of epoch lengths because it was not obvious from the data at what time scale predictive features might be present in the data, or how quickly they might change over time.

Figure 2. EEG data in MAT files separated into sequential epochs.
Extracting Features and Identifying the Best Machine Learning Models
Unlike many data analysis competitions, the seizure prediction competition provided an opportunity to work with raw data rather than ready-made tables. Apart from re-referencing, the data provided had not undergone any additional preprocessing. The unstructured nature of the data allowed me to make the most of this data by performing my own preprocessing and feature extraction.
I worked in MATLAB to extract features from the data that I could use to train machine learning models. Specifically, I developed algorithms that, for each epoch, computed the frequency band powers, summary statistics on each channel (including mean, standard deviation, root mean square, skewness, and kurtosis), and correlation between channel pairs in temporal and frequency domains. I cut processing time almost in half by using Parallel Computing Toolbox™ to simultaneously process the training and test data on different cores.
Because I was developing algorithms for the competition in my spare time, and not as a principal research activity, I wanted to develop a solution as quickly as possible. I have experience with supervised machine learning in other environments, but chose to use the Classification Learner app in Statistics and Machine Learning Toolbox™ to quickly search for the best classification model type for the features I had extracted. In a matter of minutes, the app had automatically trained and assessed models based on decision trees, discriminant analysis, support vector machines, logistic regression, nearest neighbors, and ensemble methods using boosted trees. It would have taken me days if not weeks of development time to construct and test all these machine learning models in Python or R.
Improving Prediction Accuracy
Next, I set about improving the performance of the two most promising machine learning models identified by the Classification Learner app: quadratic support vector machines and random undersampling (RUS) boosted trees. I tested various features and epoch lengths, ultimately identifying the 80-second, 160-second, and 240-second epoch lengths as the most important to the classification (Figure 3). Because I was working with multiple training and test sets, I had to manage and name numerous tables representing various combinations of features and epoch lengths. I used the new String class in MATLAB to programmatically generate labels for the tables. The String class eliminated a block of complex code that I had previously used for generating labels.
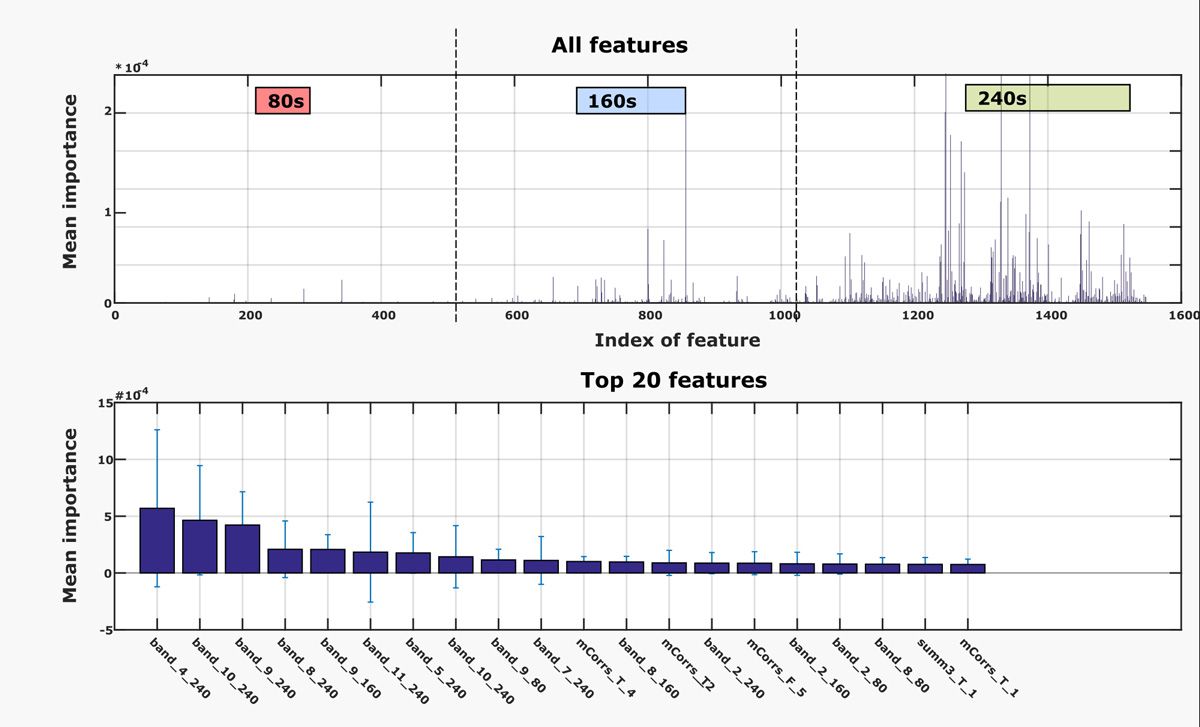
Figure 3. Plots showing relative importance of features and epoch lengths.
After testing the machine learning algorithms on local data, I submitted them to the Kaggle competition website, which ran them against a set of undisclosed test data. Algorithms were scored by calculating the area under the receiver operating characteristic curve (AUC), which is a common measure for evaluating binary classifiers and the competition’s official scoring metric. The results of this scoring were published on a frequently-updated public leaderboard so that contestants could see how well their algorithms were performing relative to others in the competition.
To further improve the accuracy of my algorithms, I tried several other techniques, including hyperparameter optimization. One of the most effective techniques I used was to implement an ensemble classifier by combining the SVM and RUS boosted tree models. Averaging the predictions of the two models resulted in a dramatic improvement in accuracy, enabling the ensemble classifier to score higher than either of its component models individually. The results were as follows:
SVM alone: ~0.65 AUC
RUS alone: ~0.72 AUC
SVM and RUS ensemble: ~0.80 AUC C
An Early Step Towards Better Epilepsy Management
Most of the contestants trained three separate machine learning models, one for each epilepsy patient. I created a single general model that worked for all three patients because I felt that in clinical practice, this solution would be more efficient than one that required EEG data to be collected from each patient. Clinically, a key aim (and difficulty) is to create models that can generalize across patients and make predictions for unseen individuals rather than training separate classifiers for each patient. It remains to be seen how effective the models produced in the competition are at predicting for new patients. As a first step toward incorporating the competition algorithms into clinical studies, University of Melbourne researchers are conducting further evaluation of the submitted algorithms using data that was not made available as part of the competition.
Aside from the competition’s potential benefits to epilepsy research, I benefitted personally from the opportunity to participate. For me, the competition was a deeply engaging way to learn new skills while potentially advancing research in an area that will benefit millions of epilepsy sufferers worldwide.
Published 2017 - 93132v00