Automated Driving Simulations with a 3D Digital Twin
Determining Actual Hybrid Vehicle Performance in a Classroom
Nearly 200 second-year undergrads gathered in an airy Waseda University classroom. Students readied their laptops for the Project-Based Learning Advanced lecture series, a required Department of Mechanical Engineering course that teaches specialized problem-solving skills through project assignments to enhance competencies.
Professor Jin Kusaka’s environment and mobility section presented a driver model created using Simulink® and RoadRunner for a series hybrid electric vehicle (SHEV), an electric vehicle with an internal combustion engine and a battery-powered electric motor, making a loop near the university. Students learned how to operate the integrated model and perform simulations to obtain a fuel economy rating. They then discussed with classmates how fuel efficiency can be improved.
“Most students cannot visualize what it is like to drive a car when the numbers spit out from a vehicle simulation are simply graphed,” Kusaka says. “We sought to spark their imagination.”
Kusaka, a well-known mechanical engineering professor who leads Waseda University’s Research Organization for Next Generation Vehicles, is influential in the Japanese automobile industry. His roles in the Society of Automotive Engineers of Japan include director of technology and vice president. While a graduate student at Waseda, he conducted methanol engine research with Koji Sato, the president of Toyota Motor Corporation.
Kusaka challenged students in the lecture series to think like automotive engineers focused on optimizing fuel economy and electricity costs. The goal is to prepare the students for careers in the automotive industry, with which Waseda University maintains strong ties. The headquarters of several major Japanese automakers are nearby, and alumni include C-suite executives at global corporations such as Toyota, Nissan, and Isuzu.
“We conduct research projects with automotive companies, automotive-related companies, heavy industries, government agencies, and the Automotive Internal Combustion Engine Technology Research Association (AICE),” Kusaka says. His laboratory has a joint green innovation project developing a catalyst for hybrid vehicles using e-fuel with AICE. This national organization fosters collaboration across academia, the government, and industry. He also advises local and national government committees on emissions and fuel economy.
“Globally, emissions and fuel economy regulations are becoming increasingly strict from an environmental protection perspective,” Kusaka says. “Automotive companies need to create vehicles that meet these regulations.”
With that in mind, Kusaka and Soraki Harada, a second-year master’s student in Kusaka’s lab conducting research on automotive powertrains, utilized Waseda’s MathWorks Campus-Wide License for the lecture series, choosing Simulink and RoadRunner for their advanced functionality and ease of use.
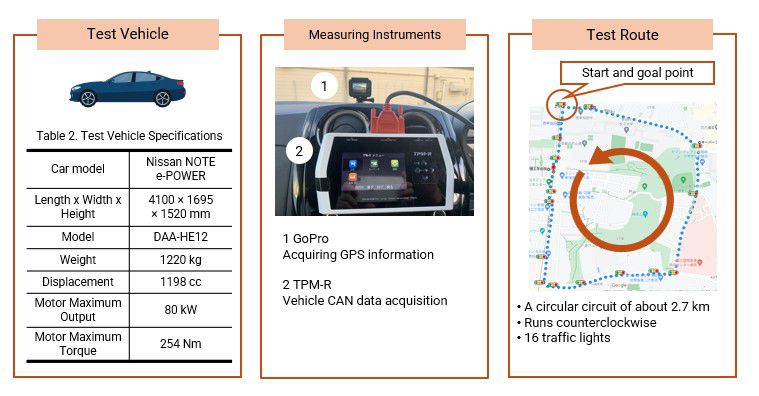
The lab team began by driving a 2016 Nissan® Note e-POWER around a preplanned route near the university. Harada pulled traffic signal and mapping data from these road tests into a Simulink driver model along with other key public information, such as road elevation and speed limits. He used RoadRunner to replicate the street scenes. Harada, teaching assistants (TAs), and MathWorks staff taught students to operate the integrated model and run simulations. Students could reproduce real road and traffic environments effectively to determine fuel economy ratings.
Simulated driving in RoadRunner. (Video credit: Waseda University)
“Students achieved multiple goals in the class,” Kusaka reflected. “Their ideas were made possible by the fact that they could visualize the vehicle actually driving around via RoadRunner animations.”
Rigorous Real-World Testing
Outside the classroom, such simulations hold enormous promise for evaluating new passenger vehicle fuel economy and electricity costs, potentially saving automakers significant R&D time and costs. Automotive engineers take real-world road conditions into account when calculating fuel economy. Significant factors include vehicle weight, acceleration, deceleration, gradient resistance, and rolling resistance. As vehicle speed increases, air resistance plays a larger role, too.
Simulations using Simulink and RoadRunner can predict performance in advance, avoiding the need to purchase expensive specialized measuring equipment and conduct tests on actual vehicles.
Kusaka’s research compared emerging Real Driving Emissions (RDE) testing with the conventional Worldwide Harmonized Light duty vehicle Test Procedure (WLTP) on a chassis dynamometer. Intended to complement lab testing, RDE testing measures carbon monoxide, unburnt hydrocarbons, nitrogen oxides, and particulates through portable real-time monitoring equipment in a passenger car driven on public roads. Testing occurs in different settings at varying temperature ranges, speed limits, traffic levels, and altitudes.
“There is a discrepancy between exhaust gas and fuel efficiency in conventional chassis dynamo tests and actual driving,” Kusaka notes. “RDE, which can be measured more accurately, is becoming increasingly important.”
In countries such as Japan that mandate RDE for new vehicles, the conforming factor (CF) indicates how much the exhaust gas value during actual road driving differs from that measured during the bench test. Regulators set the CF limit, and auto companies must demonstrate that the exhaust gas value on real roads doesn’t surpass it.
“During the 90 to 120 minutes of actual road driving, the vehicle must be driven on a set proportion of urban roads, rural roads, and highways. There are other constraints, such as upper limits on temperature, altitude, and maximum speed,” Kusaka explained. “Costly retesting is not uncommon.”
Simulations using Simulink and RoadRunner can predict performance in advance, avoiding the need to purchase expensive specialized measuring equipment and conduct tests on actual vehicles, Kusaka continued. Plus, finding locations with the same roads, temperatures, and altitudes that factor into RDE testing is impossible.
“RDE simulation with Model-Based Design is easily feasible,” he says. And his class was about to prove it.
3D Digital Twin
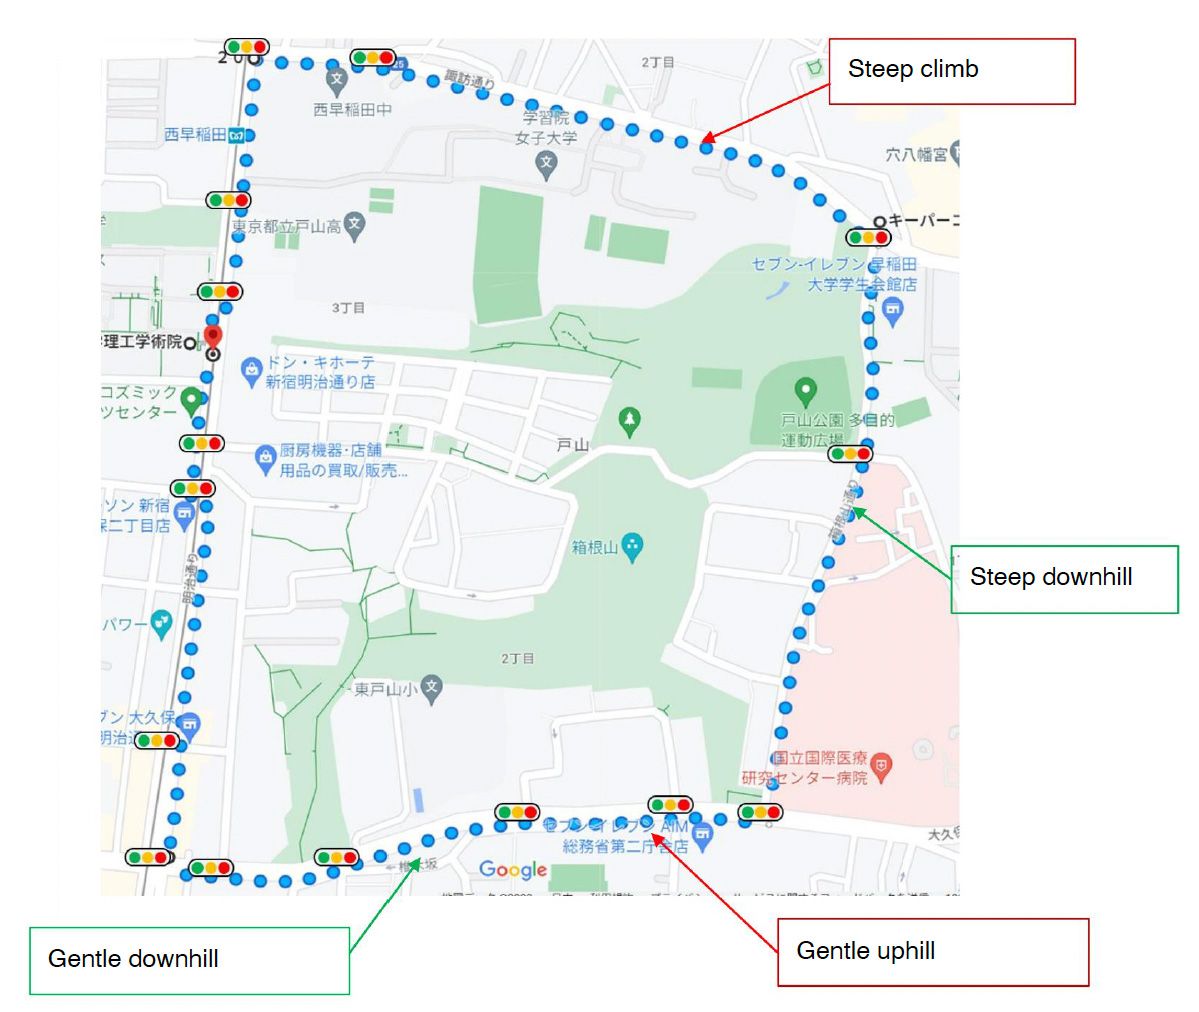
Kusaka selected a 2016 Nissan Note e-POWER since a highly accurate model for one was already developed, and he felt that students could understand the SHEV’s straightforward structure. The test route in the Shinjuku district near the university was an approximately 2.7-kilometer (1.7-mile) loop and featured varying inclines and downhills.
Driving tests took place at 1 a.m. to minimize other vehicles and pedestrians, which the lab team intentionally didn’t include in the RoadRunner Scenario and Simulink cosimulation. The initial state of charge was set to 60.0%. Each driver warmed the vehicle for 20 minutes before testing, ensuring a warm engine. An onboard GoPro acquired GPS information while a diagnostic tool collected basic vehicle data.
“I obtained map data for the area from OpenStreetMap and slope data from the Geospatial Information Authority of Japan. After uploading that to RoadRunner, I created a 3D digital twin by extracting only the roads. Working in the visual interface was very intuitive.”
Harada created a driver model in Simulink, using an autonomous driving algorithm to mimic how a human would accelerate and decelerate along the route.
He got SHEV information from a model created and published through a project led by the Ministry of Economy, Trade and Industry. He then uploaded real-world efficiency and control flow data for the Nissan Note components.
He added data for all 16 traffic signals to Simulink from timestamped test route videos. Calculations automatically determined which light was ahead of the virtual vehicle and the shortest distance away, similar to how a human driver looks at the closest light. He constructed two possible scenarios for brake control: a constant deceleration or an abrupt stop.
Traffic lights in the simulation could only be red or green. Yellow light times from the videos were divided, with one half assigned to green and the other half to red. Harada designed realistic 3D street scenes in RoadRunner.
“I obtained map data for the area from OpenStreetMap® and slope data from the Geospatial Information Authority of Japan,” he says. “After uploading that to RoadRunner, I created a 3D digital twin by extracting only the roads. Working in the visual interface was very intuitive.”
Students downloaded the combined driver model from the university’s cloud. Back in the classroom, Harada, TAs, and the MathWorks team answered questions about the 3D digital twin. Then it was the students’ turn: Their assignment was to create a video of the entire driving simulation with the bird’s-eye camera position based on the last three digits in their unique student ID numbers. For example, 123 meant the camera would be 12 meters away at a 3-meter height.
Previously, Kusaka’s students relied on calculated state-of-charge graphs, and some had difficulty connecting the calculations with actual vehicle driving, he says. This time they could visualize the results.
Advancing Efficiency
Through their 3D digital twin simulations, the students learned about powertrain control in relation to the SHEV high-voltage battery’s depth of charge by changing the initial charge amount. After that, they could compare the costs and CO2 emissions from plug-in and series hybrid electric vehicles.
“Unlike real vehicle testing, Model-Based Design can easily test vehicle differences. Students who took the class saw firsthand how fuel consumption can be improved by utilizing plug-in hybrid vehicles,” Kusaka says. “The ability to assign this exercise to a second-year undergraduate class was great.”
“Unlike real vehicle testing, Model-Based Design can easily test vehicle differences. Students who took the class saw firsthand how fuel consumption can be improved by utilizing plug-in hybrid vehicles.”
Kusaka noticed that students’ data analysis and interpretation skills improved with Simulink and RoadRunner compared to previous years. They identified changing rolling resistance, altering air resistance, and increasing the engine’s thermal efficiency as factors in thermal energy conversion efficiency. Some also suggested advanced ideas for engine control.
“Utilizing Model-Based Design and Simulink, students explored the impact on fuel efficiency if thermal efficiency were increased to 50% or if a plug-in hybrid system were implemented,” Harada says.
The group found that increasing the thermal efficiency of the engine’s operating area to about 50% could reduce fuel consumption to 21.52 megajoules—a 37% reduction from the baseline. Students gained automotive knowledge that they could apply in the real world.
“Engineering graduates who know how to use Model-Based Design for automotive R&D will be prepared to start work right away,” Kusaka says. After graduation, Harada will join Toyota Motor Corporation, where he looks forward to utilizing Model-Based Design and equipment testing to develop cars, drawing directly from his lab experiences.
Recently, the Kusaka Lab began research on improving thermal efficiency and exhaust gas emissions for plug-in hybrid electric vehicles with early engine warmup during cold starts. RDE testing supports a wider temperature range than WLTP testing, so a wintertime startup could have ripple effects. The team also plans to expand the driver model for the lecture series to incorporate the impact of acceleration and deceleration on fuel efficiency. Factors being considered for acceleration and deceleration include pedestrians, other vehicles, and curves.
The researchers envision their industry partners benefitting greatly from Simulink and RoadRunner. “If everything about the car is represented in a common model that the automobile manufacturer and supplier handle, it becomes easier to predict the performance when a part changes,” Kusaka said. “We believe that Model-Based Design and its simulation of vehicle development and RDE tests will contribute significantly to reducing costs for automotive companies.”
Read Other Stories
ROBOTICS / AUTOMATED DRIVING
Designing WATonoBus, the Autonomous Shuttle Bus on Campus
Self-Driving Shuttle Is an Ideal Platform for Developing ADAS Technology
AUTOMATED DRIVING / ROBOTICS
Applying Proven Robotics Techniques to Automobile Development Processes
Renault Advances ADAS Prototyping with ROS Toolbox and Simulink Integration
AUTOMATED DRIVING
Aptiv Implements Virtual Scenarios for ADAS Validation
Workflow Helps Evaluate Model Performance, Cutting Costs and Enhancing Efficiency


