hold
Retain current plot when adding new plots
Description
hold on sets the axes hold state to on, which retains plots in
the current axes so that new plots added to the axes do not delete existing plots. When
the hold state is on, new plots use the next colors and line styles based on the
ColorOrder and LineStyleOrder properties of the
axes. MATLAB® adjusts axes limits, tick marks, and tick labels to display the full range
of data. If an axes object does not exist, then the hold command
creates one.
hold off sets the axes hold state to off so that new plots added
to the axes clear existing plots and reset all axes properties. When the hold state is
off, the next plot added to the axes uses the first color and line style based on the
ColorOrder and LineStyleOrder properties of the
axes. This option is the default behavior.
hold toggles the hold state between on and off.
hold( sets the axes hold state by
specifying a state)state value. You can specify state as
"on", "off", a logical value, or an
OnOffSwitchState value.
Examples
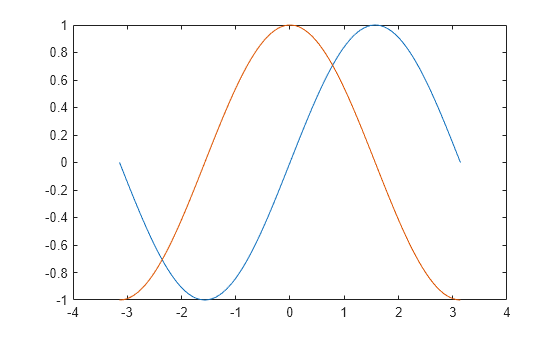
Create a line plot. Use hold on to add a second line plot without deleting the existing line plot. The new plot uses the next color and line style based on the ColorOrder and LineStyleOrder properties of the axes. Then reset the hold state to off.
x = linspace(-pi,pi);
y1 = sin(x);
plot(x,y1)

hold on
y2 = cos(x);
plot(x,y2)
hold off
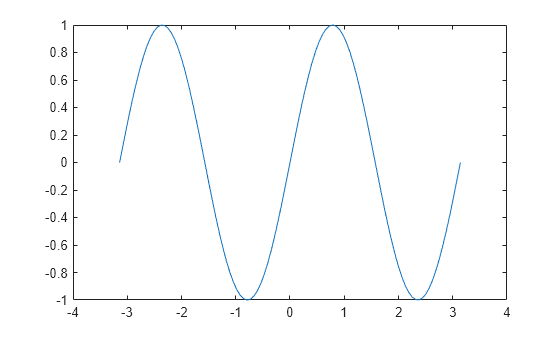
When the hold state is off, new plots delete existing plots. New plots start from the beginning of the color order and line style order.
y3 = sin(2*x);
plot(x,y3)
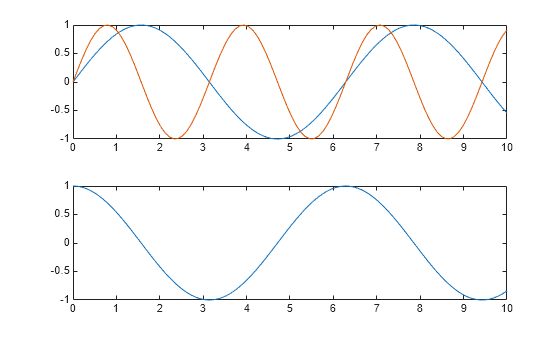
You can display a tiling of plots using the tiledlayout and nexttile functions. Call the tiledlayout function to create a 2-by-1 tiled chart layout. Call the nexttile function to create the axes objects ax1 and ax2. Plot a sine wave plot in each axes.
x = linspace(0,10);
y1 = sin(x);
y2 = cos(x);
tiledlayout(2,1)

% Top plot
ax1 = nexttile;
plot(ax1,x,y1)

% Bottom plot
ax2 = nexttile;
plot(ax2,x,y2)

Add a second sine wave to the top axes.
hold(ax1,'on')
y3 = sin(2*x);
plot(ax1,x,y3)
hold(ax1,'off')
Create a 1-by-2 tiled chart layout. Call the nexttile function to create two axes objects and plot into the axes.
t = tiledlayout(1,2);
ax1 = nexttile;
ax2 = nexttile;
plot(ax1,[0 1 0 1])
scatter(ax2,rand(1,10),rand(1,10),'filled')
Set the hold state for both of the axes to 'on'. Then display additional data in each plot.
hold([ax1 ax2],'on')
plot(ax1,[.5 .2 .5 .2])
scatter(ax2,rand(1,10),rand(1,10),'filled')

Input Arguments
Tips
Use the
isholdfunction to test the hold state.
Algorithms
The hold function sets these properties: