imcontour
Create contour plot of image data
Syntax
Description
imcontour( draws a contour plot of the
grayscale image I)I, choosing the number of levels and the values
of levels automatically. imcontour automatically sets up the
axes so their orientation and aspect ratio match the image.
imcontour(___,
draws the contours using the line type and color specified by
LineSpec)LineSpec. Marker symbols are ignored.
Examples
Create Contour Plot of Image Data
Read and display a grayscale image.
I = imread("rice.png");
imshow(I)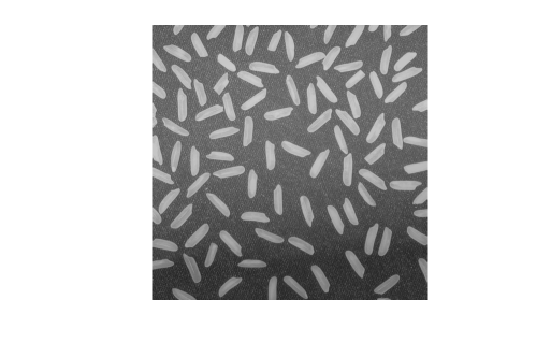
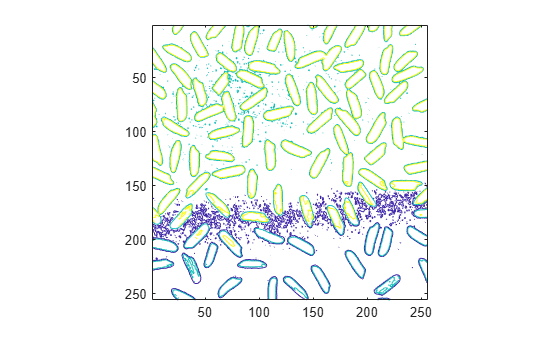
Create a contour plot of the image with three contour levels.
imcontour(I,3);
Input Arguments
I — Grayscale image
m-by-n matrix
Grayscale image, specified as an m-by-n matrix.
Data Types: single | double | int16 | uint8 | uint16 | logical
levels — Number of contour levels
numeric scalar
Number of contour levels, specified as a numeric scalar.
V — Value of contour levels
numeric vector
Value of contour levels, specified as a numeric vector with length greater
than or equal to two. Use V = [v v] to compute a single
contour at level v.
x — Image x values
2-element numeric vector | n-element numeric vector
Image x values, specified as one of the following:
2-element numeric vector of the form
[xmin
                                        xmax]
— Image extent in the x direction.n-element numeric vector — x-coordinate of each column.
y — Image y values
2-element numeric vector | m-element numeric vector
Image y values, specified as one of the following:
2-element numeric vector of the form
[ymin
                                        ymax]
— Image extent in the y direction.m-element numeric vector — y-coordinate of each row.
LineSpec — Line style and color
character vector | string scalar
Line style and color, specified as a character vector or string scalar containing a line style specifier, a color specifier, or both.
Example: "--r" specifies red dashed lines
These two tables list the line style and color options.
| Line Style | Description | Resulting Line |
|---|---|---|
"-" | Solid line |
|
"--" | Dashed line |
|
":" | Dotted line |
|
"-." | Dash-dotted line |
|
| Color Specifier | Description | Appearance |
|---|---|---|
| red |
|
| green |
|
| blue |
|
| cyan |
|
| magenta |
|
| yellow |
|
| black |
|
| white |
|
Output Arguments
Version History
Introduced before R2006a
You can also select a web site from the following list:
Americas
- América Latina (Español)
- Canada (English)
- United States (English)
Europe
- Belgium (English)
- Denmark (English)
- Deutschland (Deutsch)
- España (Español)
- Finland (English)
- France (Français)
- Ireland (English)
- Italia (Italiano)
- Luxembourg (English)
- Netherlands (English)
- Norway (English)
- Österreich (Deutsch)
- Portugal (English)
- Sweden (English)
- Switzerland
- United Kingdom (English)